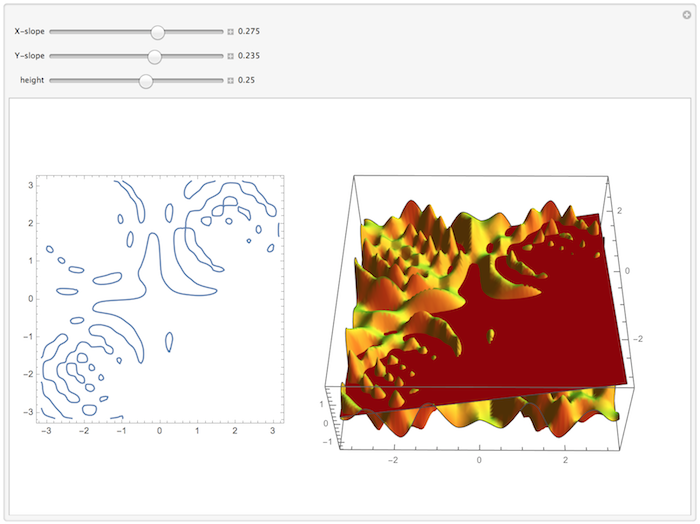
Craig, I somehow missed this answer - I like it a lot. Here is a small app to watch things in action:
Manipulate[
Row[{
ContourPlot[
intSurface[x, y] == c + a x - b y, {x, -Pi, Pi}, {y, -Pi, Pi},
ImageSize -> 300],
Plot3D[{intSurface[x, y], c + a x - b y}, {x, -Pi, Pi}, {y, -Pi,
Pi}, PlotStyle -> {Yellow, Red}, Mesh -> None, PlotPoints -> 30,
ViewPoint -> {0.01, -2.14, 2.62}, ViewVertical -> {0, 0, 1},
SphericalRegion -> True, ImageSize -> 450]
}],
{{a, .275, "X-slope"}, -1, 1, Appearance -> "Labeled"},
{{b, .235, "Y-slope"}, -1, 1, Appearance -> "Labeled"},
{{c, .25, "height"}, -2, 2, Appearance -> "Labeled"},
Initialization :>
(surface =
Flatten[Table[{{x, y},
Sin[x + y + RandomReal[{-0.1, 0.1}]] Sin[2 Pi y x]}, {x, -Pi,
Pi, 2 Pi/24}, {y, -Pi, Pi, 2 Pi/24}], 1];
intSurface = Interpolation[surface];)]
