You can pass an option Joined -> False to the DateListPlot function, but it will eliminate all connections (including those inside your data segments) in the graph. If you want to keep them you'd have to divide your data into pieces manually and then plot them using DateListPlot[{datarange1, datarange2, ...}], as far as I know.
P.S. Or else you can use some of the WL clusterizing algorithms to divide your data automatically. For example,
datasets = FindClusters[data,
DistanceFunction -> Function[{o1, o2}, QuantityMagnitude[DateDifference[o2[[1]], o1[[1]]]]]
];
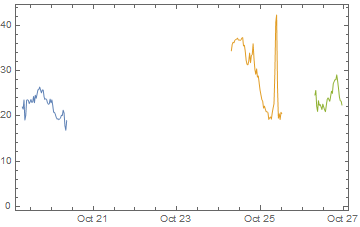
DateListPlot[datasets]
produced the following picture: