Group Abstract Group Abstract

Message Boards Message Boards

0
|
4.7K Views
|
2 Replies
|
0 Total Likes
View groups...
Share
Share this post:

[Solved] Positions of graphics primtives within a Graphics function

Posted 5 years ago

Hello

I expected with the code below to have the blue rectangle start at the beginning of the second segment of the line and the red rectangle at the beginning of the third segment..Their orientations are correct but not their positions. Why is it so and how is this code to be modified ?

 rectangle = Rectangle[{0, 0}, {2, 0.5}];
 Graphics[{Line[{{0, 0}, pos1 = {2 Sqrt[3], 2}, 
     pos2 = {2 Sqrt[3], 7}, {7, 7}}], Rotate[rectangle, Pi/6, {0, 0}], 
   Blue, Rotate[rectangle, Pi/2, pos1],
   Red, Rotate[rectangle, 0, pos2]}]

Mathematica V11.3 Thanks

POSTED BY: Jan Potocki
2 Replies
Posted 5 years ago

Nice answer. Thanks.

POSTED BY: Jan Potocki
Posted 5 years ago

Hi Jan,

The problem is that all the rectangles have the same absolute coordinates {0, 0}, {2, 0.5} so a rotation about a point is not sufficient to position them in the right place. A translation is also needed. Or create rectangles with the right coordinates and rotations e.g.

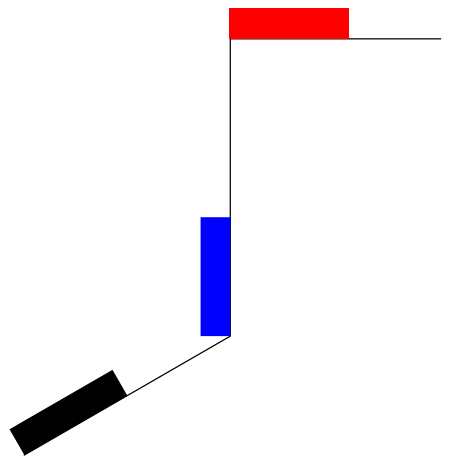
positions = {{0, 0}, {2 Sqrt[3], 2}, {2*Sqrt[3], 7}};
rotations = {Pi/6, Pi/2, 0};
colors = {Black, Blue, Red};

rectangles = Rectangle[#, # + {2, 0.5}] & /@ positions;
rotatedRectangles = 
 MapThread[{#1, Rotate[#2, #3, #4]} &, {colors, rectangles, rotations, positions}];

Graphics[{Line[Append[positions, {7, 7}]], rotatedRectangles}]

enter image description here

POSTED BY: Rohit Namjoshi
Reply to this discussion
Community posts can be styled and formatted using the Markdown syntax.
Reply Preview
Attachments
Remove
or Discard