Well, I do feel some compassion for anyone being close defending a thesis! As far as I could make sense out of your data, my first approach looks like so:
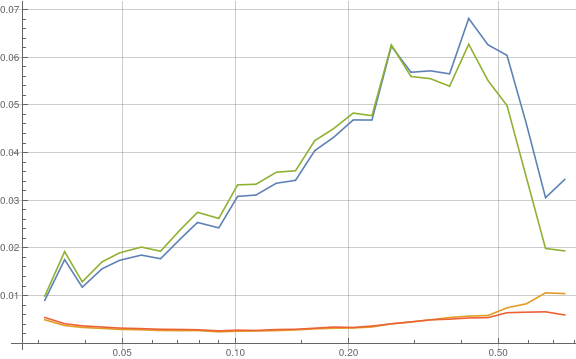
Elig1pQ3 = {{0.031, 0.009114, 0.005022478}, {0.035, 0.01764,
    0.003807447}, {0.039, 0.011856, 0.003416231}, {0.044, 0.015708,
    0.00321441}, {0.049, 0.017493, 0.003006221}, {0.056, 0.018592,
    0.002923286}, {0.063, 0.017829, 0.002772716}, {0.071, 0.021939,
    0.002742476}, {0.079, 0.025438, 0.002759351}, {0.09, 0.0243,
    0.002495776}, {0.101, 0.030906, 0.002620167}, {0.113, 0.031188,
    0.002678839}, {0.128, 0.033664, 0.002748277}, {0.144, 0.034272,
    0.002897944}, {0.162, 0.0405, 0.003116132}, {0.182, 0.043316,
    0.003255715}, {0.205, 0.046945, 0.003305526}, {0.23, 0.04692,
    0.003510798}, {0.259, 0.062419, 0.00417625}, {0.292, 0.05694,
    0.004570523}, {0.329, 0.057246, 0.005011179}, {0.37, 0.05661,
    0.005500445}, {0.416, 0.068224, 0.00579421}, {0.468, 0.062712,
    0.005919784}, {0.526, 0.06049, 0.007531174}, {0.592, 0.046176,
    0.008372144}, {0.666, 0.030636, 0.010676792}, {0.749, 0.034454,
    0.010512716}};

Elig1pQ5 = {{0.031, 0.009982, 0.005503701}, {0.035, 0.01932,
    0.004207285}, {0.039, 0.012987, 0.003749278}, {0.044, 0.01716,
    0.003507327}, {0.049, 0.019061, 0.003286289}, {0.056, 0.020272,
    0.00317229}, {0.063, 0.019404, 0.003030555}, {0.071, 0.023856,
    0.002992968}, {0.079, 0.027571, 0.002935783}, {0.09, 0.02628,
    0.002696998}, {0.101, 0.03333, 0.002845979}, {0.113, 0.033448,
    0.002779432}, {0.128, 0.035968, 0.002977204}, {0.144, 0.036288,
    0.003027427}, {0.162, 0.042606, 0.003260187}, {0.182, 0.045136,
    0.00350084}, {0.205, 0.04838, 0.00341188}, {0.23, 0.04784,
    0.003708639}, {0.259, 0.062678, 0.00417625}, {0.292, 0.056064,
    0.004570523}, {0.329, 0.055601, 0.005011179}, {0.37, 0.05402,
    0.005153504}, {0.416, 0.062816, 0.005408}, {0.468, 0.055224,
    0.0054778}, {0.526, 0.04997, 0.006506261}, {0.592, 0.034928,
    0.006618761}, {0.666, 0.01998, 0.006693217}, {0.749, 0.019474,
    0.006038631}};

data0 = Flatten[Transpose /@ {Elig1pQ3, Elig1pQ5}, 1];
xvals = First[data0];
yvals = data0[[{2, 3, 5, 6}]];
data1 = Thread[{xvals, #}] & /@ yvals;
ListLogLinearPlot[data1, Joined -> True, ImageSize -> Large, GridLines -> Automatic]