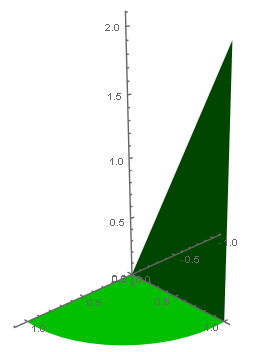
Group Abstract Group Abstract

Message Boards Message Boards

0
|
4.1K Views
|
3 Replies
|
3 Total Likes
View groups...
Share
Share this post:

How to graph 2D function in a 3D plot?

Posted 4 years ago

Hi, I wanto to graph, Plot[Sqrt[4-x^2], {x, 0, 2}], but I want to see that graph in 3D?

How can I do that?

I want to create something like this graph.
Grafico

I wanto to graph, Plot[Sqrt[4-x^2], {x, 0, 2}], but I want to see that graph in 3D?

How can I do that?

POSTED BY: Victor Perdomo
3 Replies
Posted 4 years ago

Thanks you, so much! My paper will be more easy to understand with this plot.

POSTED BY: Victor Perdomo
Posted 4 years ago
POSTED BY: Hans Milton
POSTED BY: Henrik Schachner
Reply to this discussion
Community posts can be styled and formatted using the Markdown syntax.
Reply Preview
Attachments
Remove
or Discard