You can download the shapefiles from the
Global Administrative Areas.
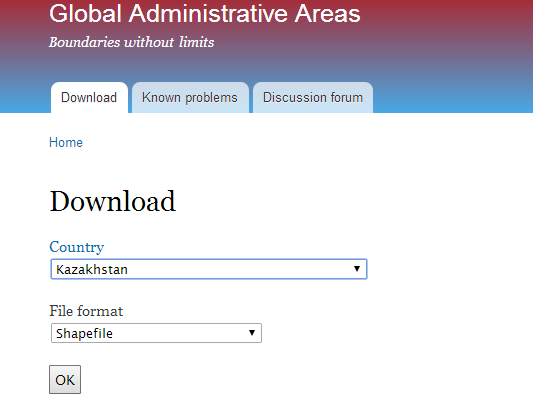
If you expand the Zip File you'll find that the regions can be found at level 1. So we can import both th shapefile and database into Mathematica.
kazakhstan = Import["C:\\Users\\Diego\\Documents\\Downloads\\KAZ_adm\\KAZ_adm1.shp", "Graphics"];
regions = Import["C:\\Users\\Diego\\Documents\\Downloads\\KAZ_adm\\KAZ_adm1.dbf"];
(*Modified the XLS file so the names of the Regions will match in XLS *)
data = Import["ModifiedCountryMap.xlsx", "Data"][[1]] // Rest;
(*Shapes of the different regions can be found at this level of the list - This was done by checking the list content visually *)
regionsKaz = kazakhstan[[1]][[2]][[1]][[2]];
minValue = Min@data[[All, 5]]; maxValue = Max@data[[All, 5]];
myScale[value_, min_, max_] := (value - min)/(max - min) // N
(*Testing to see if the map works*)
Module[{a},Show[Graphics[{EdgeForm[Gray], ColorData["TemperatureMap"][ myScale[a = First@Cases[data, {regions[[#, 5]], info1_, info2_, info3_, infoTotal_} -> infoTotal], minValue, maxValue]], Tooltip[regionsKaz[[#]],Column[{regions[[#, 5]], a}, Center, Frame -> True]]}] & /@ Range[14], Frame -> True, FrameTicks -> None, PlotLabel -> "Kazakhstan", ImageSize -> Large]]
 Attachments:


