Message Boards Message Boards

Implementing a function to determine the standard error?

Posted 3 years ago

Basically, my task is in the question. I need to find out the standard error and I've actually written the code like I imagine it should be. I'll attach a screenshot indicating the output. It should not be this way. Where have I made mistakes?

The code:

In[136]:= Needs["ErrorBarPlots`"]

standardError[val_] := StandardDeviation[val]/Sqrt[val["PathLength"]]

In[33]:= coeficientOfVariation[val_] := 
 StandardDeviation[val]/Mean[val["PathLength"]]

In[13]:= errorBar[type_: "GlassRectangle"][{{x0_, x1_}, {y0_, y1_}}, 
  value_, meta_] := 
 Block[{error, mags = QuantityMagnitude[value]}, 
  error = Flatten[QuantityMagnitude[meta]];
  error = 
   If[error === {}, 0, 
    Last[error]]; {ChartElementData[type][{{x0, x1}, {y0, y1}}, mags, 
    meta], {Black, 
    Line[{{{(x0 + x1)/2, y1 - error}, {(x0 + x1)/2, 
        y1 + error}}, {{1/4 (3 x0 + x1), 
        y1 + error}, {1/4 (x0 + 3 x1), 
        y1 + error}}, {{1/4 (3 x0 + x1), 
        y1 - error}, {1/4 (x0 + 3 x1), y1 - error}}}]}}]

In[7]:= RadM = {7.3, 6.8, 8.2}
RadH = {6.1, 9.4, 11}
RadR = {7.4, 5.9, 4.9}
RadB = {13.8}

In[28]:= stdErr = standardError[RadM]

Out[28]= standardError[{7.3, 6.8, 8.2}]

In[29]:= varCoef = coefficientOfVariation[RadM]

Out[29]= coefficientOfVariation[{7.3, 6.8, 8.2}]

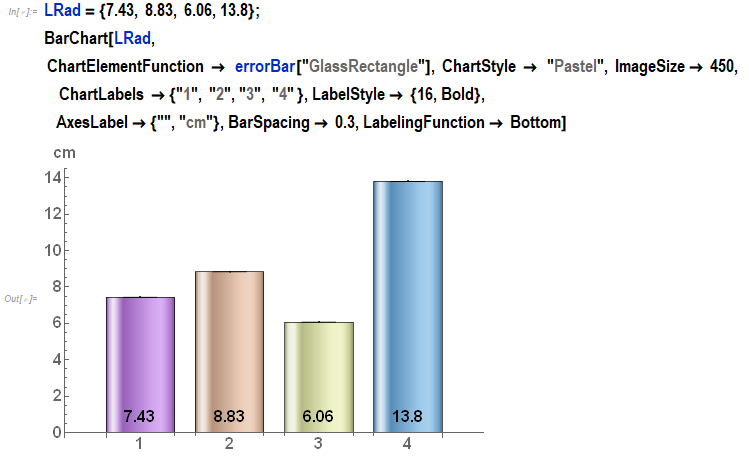
Here's the resulting graph:

enter image description here

POSTED BY: Ion Ganea
7 Replies
Posted 3 years ago

You have a few errors in the code.

  • The definition of coeficientOfVariation[val_] is missing an additional f.
  • Sqrt[val["PathLength"]] should be Sqrt[Length[val]].
  • Mean[val["PathLength"]] should be Mean[val].
POSTED BY: Jim Baldwin
Posted 3 years ago

Out[28] and Out[29] have not evaluated standardError and coefficientOfVariation which means those functions have not been defined. Did you evaluate the cells that contain the definition?

POSTED BY: Rohit Namjoshi
Posted 3 years ago

The functions standardError and coefficientOfVariation were evaluated.

POSTED BY: Ion Ganea
Posted 3 years ago

One way to include error bars in BarChart is with Around:

standardError[val_] := StandardDeviation[val]/Sqrt[Length[val]]
LRed = {7.43, 8.83, 6.06, 13.8};
stdErr = standardError[LRed];
LRedAround = Map[Around[#, stdErr] &, LRed];
BarChart[LRedAround, ChartElementFunction -> "GlassRectangle", 
 ChartStyle -> "Pastel"]

which gives: enter image description here

POSTED BY: Oliver Seipel
Posted 3 years ago

The lines indicating the error are not the same as the error. The errors have different values while the lines are all the same.

POSTED BY: Ion Ganea
Posted 3 years ago

It is not so obvious what your data are:)

Lets say you have computed your mean data and errors to be:

mean = {7.43, 8.83, 6.06, 13.8};
errors = {4, 3, 2, 1};

then you wrap Around to your data:

data = Apply[Around, Transpose[{mean, errors}], 1];

and BarChart it:

BarChart[data, ChartElementFunction -> "GlassRectangle", 
 ChartStyle -> "Pastel"]

which gives:

enter image description here

POSTED BY: Oliver Seipel
Posted 3 years ago

Thank you for your help. Unfortunately, I need just a bit more. This section's been giving me a few errors. I made a few changes and it seemed to go well but after saving and restarting, they're back.

standardError[val_] := StandardDeviation[val]/Sqrt[Length[val]]
LRad = {7.43, 10.1, 6.07, 9.65};
stdErr = standardError[LRad];

LRad = Apply[Around, Transpose[{LRad, stdErr}], 1];
BarChart[LRad, ChartElementFunction -> "GlassRectangle", 
 ChartStyle -> "Pastel", ImageSize -> 500,
  ChartLabels -> {"1", "2", "3", "4" }, LabelStyle -> {16, Bold},
 AxesLabel -> {"", "cm"}, BarSpacing -> 0.3, 
 LabelingFunction -> Bottom]

The errors: errors

POSTED BY: Ion Ganea
Reply to this discussion
Community posts can be styled and formatted using the Markdown syntax.
Reply Preview
Attachments
Remove
or Discard

Group Abstract Group Abstract