Hello,
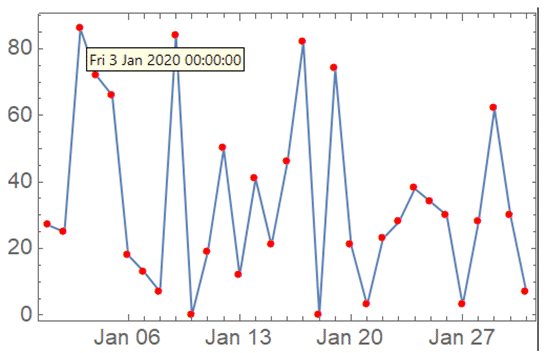
In my DateListPlot below, the "Tooltip" pointed out the "Date" only, but I need "Date and Data".
Please can you help.
Thanks....Jos
fakedata = {{{2020, 1, 1}, 27}, {{2020, 1, 2}, 25}, {{2020, 1, 3},
86}, {{2020, 1, 4}, 72}, {{2020, 1, 5}, 66}, {{2020, 1, 6},
18}, {{2020, 1, 7}, 13}, {{2020, 1, 8}, 7}, {{2020, 1, 9},
84}, {{2020, 1, 10}, 0}, {{2020, 1, 11}, 19}, {{2020, 1, 12},
50}, {{2020, 1, 13}, 12}, {{2020, 1, 14}, 41}, {{2020, 1, 15},
21}, {{2020, 1, 16}, 46}, {{2020, 1, 17}, 82}, {{2020, 1, 18},
0}, {{2020, 1, 19}, 74}, {{2020, 1, 20}, 21}, {{2020, 1, 21},
3}, {{2020, 1, 22}, 23}, {{2020, 1, 23}, 28}, {{2020, 1, 24},
38}, {{2020, 1, 25}, 34}, {{2020, 1, 26}, 30}, {{2020, 1, 27},
3}, {{2020, 1, 28}, 28}, {{2020, 1, 29}, 62}, {{2020, 1, 30},
30}, {{2020, 1, 31}, 7}};

DateListPlot[
Tooltip[#, DateString[First@#], TooltipStyle -> 14] & /@ fakedata,
PlotMarkers -> Style["\[Bullet]", FontSize -> 20, Red]]
