In your code, Solve produces a rule, not a value. In the code below I modified this to extract the rule, apply it to obtain a value, and append to solution the pair {T,value}, so Listplot would have values for the independent variable.
Two side notes:
mu(T) is a symbol, the bracket-T-bracket is not necessary.
Also, it is best to use symbol names that begin with small case because Mathematica built-in symbols begin with capitals. T is actually OK, but as an example, E is the natural log base.
Best regards,
David
ClearAll["Global'*"];
k = 8.617332478*10^-5;(*eV K^-1*)
solution = {};
For[T = 250, T <= 280,
AppendTo[solution, {T, \[Mu][T] /.
Solve[2/3*4.6 ==
Integrate[\[Epsilon]^(1/2)/
Exp[(\[Epsilon] - \[Mu][T])/(k*T)], {\[Epsilon], 0,
Infinity}], \[Mu][T]][[1, 1]]}
],
T++];
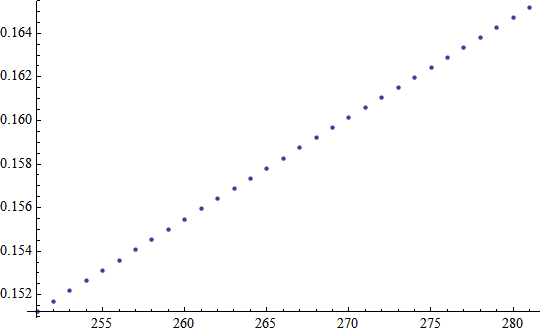
ListPlot[solution]