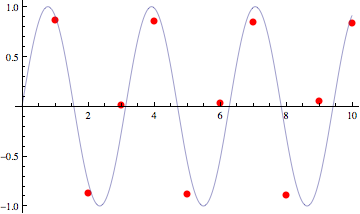
You can try making your legend separately and using GraphicsGrid to combine all three items.
lp = ListPlot[Thread[{Range[10], Sin[2.1 Range[10]]}],
PlotStyle -> {Red, PointSize -> Large}];
p = Plot[Sin[2 x], {x, 0, 10}];
twoGraphs = Show[lp, p]

Needs["PlotLegends`"]
Legend[{{Graphics[{ColorData[1][1], Thick,
Line[{{0, 0}, {1, 0}}]}],
Sin[2 x]}, {Graphics[{Red, PointSize[Large], Point[{0, 0}]}],
Sin[2.1 x]}}, LegendSize -> {1, .4}, LegendTextSpace -> .5,
LegendShadow -> None];
pl = Graphics[%];
GraphicsGrid[{{twoGraphs, pl}}]
