Group Abstract Group Abstract

Message Boards Message Boards

1
|
2.9K Views
|
5 Replies
|
2 Total Likes
View groups...
Share
Share this post:

Combined plots looking different from the individual ones?

Posted 5 years ago

Hello,

I am trying to combine two graphs that are identical in their formulas but slightly different with their parameters. Every time I try to combine them using "Show[ ]" the combined graph shows just two straight lines instead of showing the proper curves. Could it be a coding error? A size issue? I have no idea. I have attached the whole program below, plus screen shots of the specific areas and what the graphics look like.

Help is much appreciated Thank you.

Attachment

5 Replies

Thats great! however it looks like they're the same time path; one should be a bit different. Let me try what you sent me and see if I can make it work. Thank you sm!

Posted 5 years ago

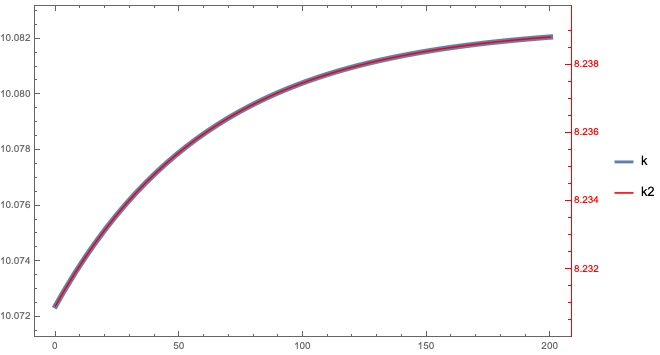
One option is to use the resource function CombinePlots. Will require some changes.

ktimepath1 =
  Plot[{Evaluate[k[t] /. solm]}, {t, 0, 200}, 
    PlotRange -> All, 
    AxesLabel -> {"t", "k"},
    PlotLegends -> {"k"},
    Frame -> True, 
    PlotStyle -> Thickness[0.01]] (* The two overlay exactly so increase thickness *)

ktimepath2 = 
  Plot[{Evaluate[k2[t] /. solm2]}, {t, 0, 200},
    PlotRange -> All, 
    AxesLabel -> {"t", "k2"},
    PlotLegends -> {"k2"}, Frame -> True, 
    FrameStyle -> Red,
    PlotStyle -> Red]

ResourceFunction["CombinePlots"][ktimepath1, ktimepath2, 
 "AxesSides" -> "TwoY",
 ImageSize -> 600]

enter image description here

POSTED BY: Rohit Namjoshi

Hi thanks for responding. How can I go about fixing it? All I want is to show the two time paths as they appear on their individual graphs but on one graph. I want to see both of them on the same time scales graph. They should look as they do (logarithmic shape) on the combined graph.

Posted 5 years ago

Hi Nathan,

The plots being combined with Show each have a very small y range that is separated by a relatively large y value between the two plots. On a combined scale they appear as straight lines. You will have to add an offset or use a log scale, or... Really depends on what you are trying to convey by combining them.

POSTED BY: Rohit Namjoshi
Reply to this discussion
Community posts can be styled and formatted using the Markdown syntax.
Reply Preview
Attachments
Remove
or Discard