Florian,
one should do one step after the other - and check after each whether the result makes sense. So, when you e.g. plot p1[v] it becomes obvious - as Gianluca has pointed out - that it cannot simply be inverted:
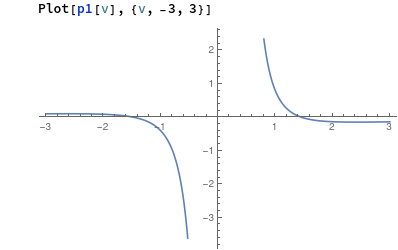
Say, you are interested in the right hand side only, you can continue like so:
p2[v_] := Piecewise[{{Infinity, v <= 0}}, p1[v]]
ip = InverseFunction[p2];
Plot[ip[t], {t, 0, 5}]
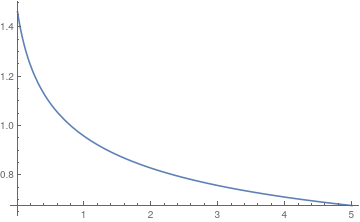
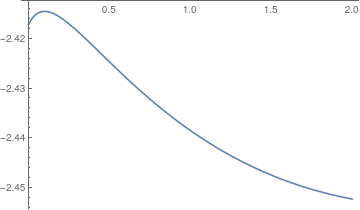
This looks promising, and then the final function can be plotted:
Plot[-T*Log[3 ip[t] - 1] + T/(3 ip[t] - 1) - 9/(4 ip[t]), {t, 0, 2}]
Here is still an important/interesting remark to make: The following does not work (as written in the o.p.):
Plot[-T*Log[3 ip[p] - 1] + T/(3 ip[p] - 1) - 9/(4 ip[p]), {p, 0, 2}]
i.e. p cannot be used as dummy variable here. The reason is that p must stay the head of the function you started with, but within Plot or Table it becomes a Block variable and will be temporarily redefined inside those environments. A simple example of that problem would read:
s[t_] := Sin[t]
Plot[s[s], {s, 0, 10}]
Does that all make sense to you?


