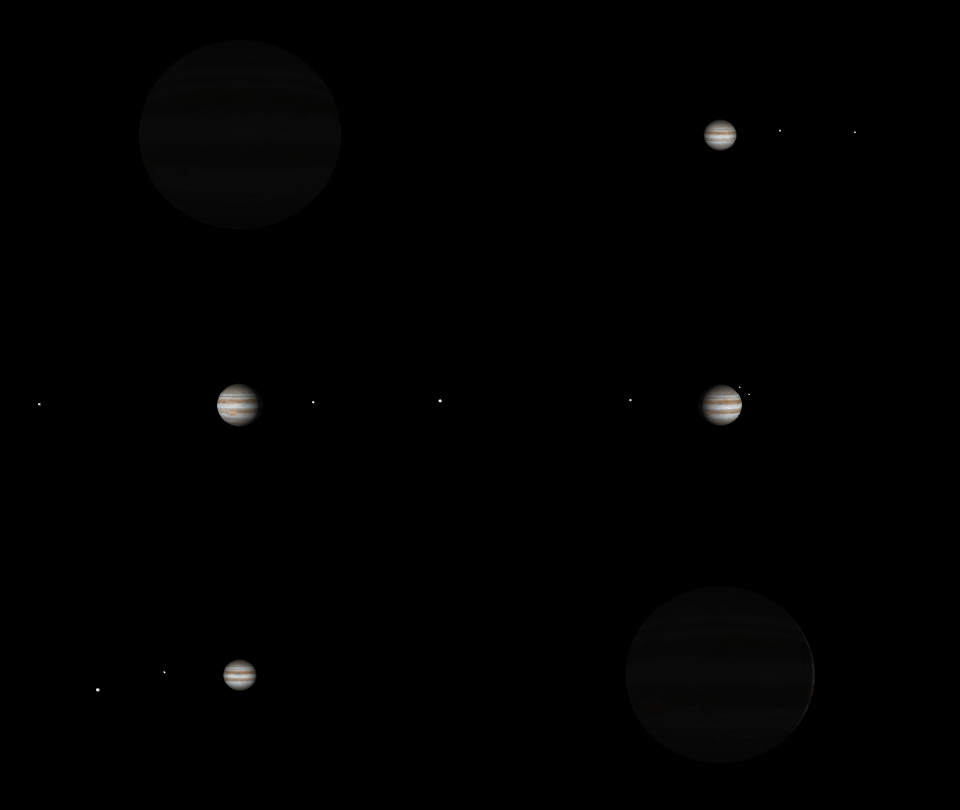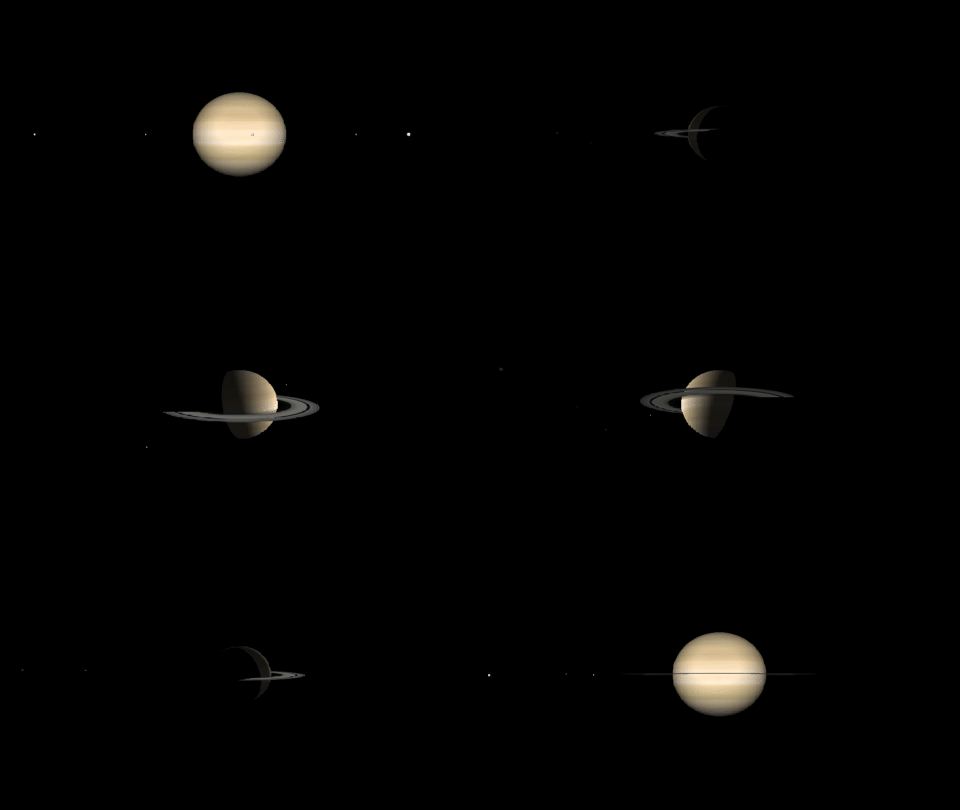

Since we have historical conjunction of Jupiter and Saturn I have prepared code with visualization planet Jupiter and Saturn with moons. First code also published here. Visualization of planet Jupiter:
JSP = QuantityMagnitude[
   UnitConvert[
     PlanetaryMoonData[{"Io", "Europa", "Ganymede",
       "Callisto"}, {"OrbitPeriod", "SemimajorAxis", "Radius"}],
     "SI"] /.
    q : Quantity[_, "Days" | "Hours"] :> UnitConvert[q, "Seconds"]];
a = Pi*RandomReal[{0, 2}, Length[JSP]];
b = 31557600*
   QuantityMagnitude[Entity["Planet", "Jupiter"]["OrbitPeriod"]]*
   Table[1/JSP[[i, 1]], {i, 1, 4}];
R = Table[JSP[[i, 2]], {i, 1, 4}];
c = Table[JSP[[i, 3]], {i, 1, 4}];
k = 3;
radius = QuantityMagnitude[
   Entity["Planet", "Jupiter"]["EquatorialRadius"], "Kilometers"];
radius1 =
  QuantityMagnitude[Entity["Planet", "Jupiter"]["PolarRadius"],
   "Kilometers"];
Xoblateness = Entity["Planet", "Jupiter"]["Oblateness"];
Xobliquity = Entity["Planet", "Jupiter"]["Obliquity"];
distanse =
  QuantityMagnitude[
   Entity["Planet", "Jupiter"]["AverageOrbitDistance"], "Kilometers"];
angularvelocity =
  Entity["Planet", "Jupiter"]["EquatorialAngularVelocity"];
texture =
  ImageReflect[
   EntityValue[Entity["Planet", "Jupiter"],
    "CylindricalEquidistantTexture"], Bottom];

planet = ParametricPlot3D[{radius Cos[t] Sin[p],
   radius Sin[t] Sin[p], (1 - Xoblateness) radius Cos[p]}, {t, 0,
   2 Pi}, {p, 0, \[Pi]}, Mesh -> None, PlotStyle -> Texture[texture],
  Lighting -> "Neutral", Boxed -> False, Axes -> False,
  PlotPoints -> 100]
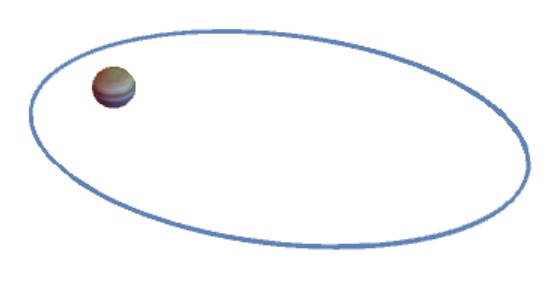
Visualization of travelling orbit (we solve restricted 3 body problem)
M1 = QuantityMagnitude[Entity["Planet", "Jupiter"]["Mass"]];
M2 = QuantityMagnitude[Entity["Star", "Sun"]["Mass"]];
Ra = QuantityMagnitude[
    Entity["Planet", "Jupiter"]["EquatorialRadius"]]*10^3;
S = QuantityMagnitude[Entity["Planet", "Jupiter"]["SemimajorAxis"]];
ar = Ra/(S*149597870700);
m = M1/M2;
G = 6.67384*10^(-11); vS =
 Sqrt[G*M1/Ra]; u0 = 16000; {ux, uy,
  uz} = {0.28309789428056364`, -2.269693660804425`,
  0.24765897137821516`}; tm = 2*0.007188414157797473;
{x0, y0, z0} = {0.9987450742768228`, -0.00006988474848081634`, \
-0.000015444353758731164`};
eq = {x''[t] ==
    2*y'[t] + x[t] - (
     m (-1 + m + x[t]))/((-1 + m + x[t])^2 + y[t]^2 + z[t]^2)^(
     3/2) - ((1 - m) (m + x[t]))/((m + x[t])^2 + y[t]^2 + z[t]^2)^(
     3/2), y''[t] == -2*x'[t] + y[t] - (
     m y[t])/((-1 + m + x[t])^2 + y[t]^2 + z[t]^2)^(
     3/2) - ((1 - m) y[t])/((m + x[t])^2 + y[t]^2 + z[t]^2)^(3/2),
   z''[t] == -((m z[t])/((-1 + m + x[t])^2 + y[t]^2 + z[t]^2)^(
      3/2)) - ((1 - m) z[t])/((m + x[t])^2 + y[t]^2 + z[t]^2)^(3/2),
   x[0.] == x0, y[0.] == y0, x'[0.] == ux, y'[0.] == uy, z'[0.] == uz,
    z[0.] == z0};
{xfun, yfun, zfun} = NDSolveValue[eq, {x, y, z}, {t, 0, tm}];
rt = RotationTransform[Xobliquity, {1, 0, 0}]; V =
 rt[S*149597870.700*{xfun[t] - 1 + m, yfun[t], zfun[t]}];

{Orbit = ParametricPlot3D[V, {t, 0, tm}], Plot[Norm[V], {t, 0, tm}]}

Show[{Graphics3D[Orbit[[1]], Boxed -> False], planet}]
We have this picture with Jupiter and orbit around 
Now we combine orbit, planet and moons in one scene, and export it as a gif (or animate).
Th = tm*31557600*
   QuantityMagnitude[
      Entity["Planet", "Jupiter"]["OrbitPeriod"]]/(3600)/(2*Pi);

frames = Table[
   Show[{Graphics3D[
      Rotate[planet[[1]], 2*Pi*Th*t/9.841666666666667/tm, {0, 0, 1}],
      Boxed -> False, Axes -> False, ImageSize -> .25 {1920, 1080}],
     Table[Graphics3D[{White,
        Sphere[{R[[i]]*Cos[a[[i]] + b[[i]]*t],
          R[[i]]*Sin[a[[i]] + b1[[i]]*t], 0}, k*c[[i]]]},
       Background -> Black, Boxed -> False, PlotRange -> All], {i, 1,
       4}]}, Background -> Black, SphericalRegion -> True,
    ViewAngle -> Pi/4, PlotRange -> All,
    Lighting -> {{"Ambient", GrayLevel[0.05]}, {"Point",
       White, {20 radius, 0, 0}}}, ViewVector -> {V, {0, 0, 0}}], {t,
    0, (1 - .0025)*tm, .0025*tm}];
Export["C:\\...\\Jupiter.gif", frames, AnimationRepetitions -> Infinity]

Second code with visualization of Saturn and moons "Mimas", "Enceladus", "Tethys", "Dione", "Rhea", "Titan" is differ from above since we need to show rings and also orbit around Saturn is not like orbit around Jupiter. The code is in notebook attached. And animation looks like this one

 Attachments: