As you can see from the posted picture, i drew eight linear function graphs. The eight functions are largely classified into two y-intercepts, which are not distinguished in the current figure(since alpha=1/137). So I want to adjust the y-axis intercept scale to distinguish between different y-sections, but I don't know how. thank you for your advice
Could the option AxesOrigin be of help?
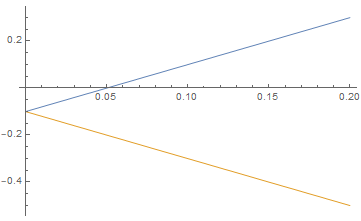
AxesOrigin
Plot[{2 x - 0.1, -(2 x + 0.1)}, {x, 0, 0.2}]
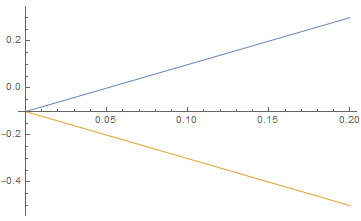
Plot[{2 x - 0.1, -(2 x + 0.1)}, {x, 0, 0.2}, AxesOrigin -> {0, -0.1}]
Take a look at PlotRange.
PlotRange