Message Boards Message Boards

0
|
2481 Views
|
6 Replies
|
4 Total Likes
View groups...
Share
Share this post:

Display multiple charts simultaneously in Manipulate[ ]?

Posted 3 years ago

Hi All, Please let me know how can I have more than one curve simultaneously? For example at rate = 0.001,0.01 & 0.1

Thank you so much.

Attachments:
6 Replies
Posted 3 years ago

Hi Adel,

Avoid use of symbol names that start with an uppercase letter, they may conflict with WL built-in symbols. Avoid use of subscripts, they are not to easy to work with, see this for details.

Separate computation of the function from visualization. One way to do that

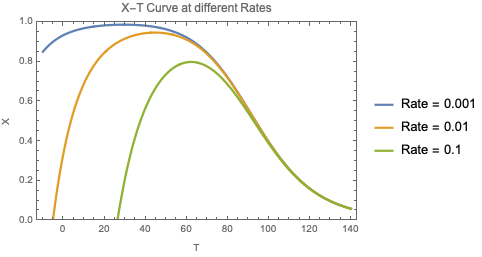
rateFn[rate_, t_] := Module[{r, k1, k2, c0, x},
  r = 8.314;
  k1 = Exp[17.34 - 48900/(r (273.15 + t))];
  k2 = Exp[42.04 - 124200/(r (273.15 + t))];
  c0 = 1;
  x /. Solve[k1 c0 (1 - x) - k2 c0 x == rate, x]]

rates = {0.001, 0.01, 0.1};
Plot[Evaluate[rateFn[#, t] & /@ rates], {t, -10, 140},
 PlotStyle -> Directive[Thickness[0.007]],
 PlotLegends -> ("Rate = " <> ToString@# & /@ rates),
 PlotLabel -> "X-T Curve at different Rates",
 FrameLabel -> {"T", "X"},
 PlotRange -> {0, 1},
 Frame -> True,
 AxesOrigin -> {0, 0}]

enter image description here

POSTED BY: Rohit Namjoshi

Hi Rohit

I cannot thank you enough for helping me,

You have presented very useful and practical points. It helped me a lot as a beginner in Mathematica.

Thank you very much, I wish you health and happiness.

Posted 3 years ago

Adel:

Before trying to get things to work in Manipulate, I suggest getting them to work with the minimum amount of code first.

Since you want to graph functions, I suggest sticking with Plot[]. Here is an example:

f[x_?NumericQ, n_Integer] := n * x;

Plot[{f[x, 2], f[x, 3], f[x, 4]}, {x, 0, 10}, 
 PlotRange -> {{0, 10}, {0, 20}}]

Keep in mind that Plot[] has many options to customize the look.

Have a great and safe holiday.

POSTED BY: Mike Besso

You're right Mike, I'm trying to rewrite the codes,

Thank you very much for your help.

Posted 3 years ago

Adel:

I think there are at least two options:

  • The documentation for Show[] provides a couple of "Basic Examples" that combine multiple plots.
  • The Plot functions accept both a single function or data argument, or a list of functions or data arguments. For an example, check out Plot[].

I hope that helps.

Have a great and safe holiday.

POSTED BY: Mike Besso

Hi Mike Thank you very much, your answer is completely principled and correct. Do you have any comment on the file I attached? I want to graph a Function(Rate) with two or more different values( for example 0.001, 0.005) ​​at the same time.

Thanks for your kindness

Reply to this discussion
Community posts can be styled and formatted using the Markdown syntax.
Reply Preview
Attachments
Remove
or Discard

Group Abstract Group Abstract