Group Abstract Group Abstract

Message Boards Message Boards

0
|
3.1K Views
|
6 Replies
|
4 Total Likes
View groups...
Share
Share this post:

Display multiple charts simultaneously in Manipulate[ ]?

Posted 4 years ago

Hi All, Please let me know how can I have more than one curve simultaneously? For example at rate = 0.001,0.01 & 0.1

Thank you so much.

Attachments:
6 Replies
Posted 4 years ago

Hi Adel,

Avoid use of symbol names that start with an uppercase letter, they may conflict with WL built-in symbols. Avoid use of subscripts, they are not to easy to work with, see this for details.

Separate computation of the function from visualization. One way to do that

rateFn[rate_, t_] := Module[{r, k1, k2, c0, x},
  r = 8.314;
  k1 = Exp[17.34 - 48900/(r (273.15 + t))];
  k2 = Exp[42.04 - 124200/(r (273.15 + t))];
  c0 = 1;
  x /. Solve[k1 c0 (1 - x) - k2 c0 x == rate, x]]

rates = {0.001, 0.01, 0.1};
Plot[Evaluate[rateFn[#, t] & /@ rates], {t, -10, 140},
 PlotStyle -> Directive[Thickness[0.007]],
 PlotLegends -> ("Rate = " <> ToString@# & /@ rates),
 PlotLabel -> "X-T Curve at different Rates",
 FrameLabel -> {"T", "X"},
 PlotRange -> {0, 1},
 Frame -> True,
 AxesOrigin -> {0, 0}]
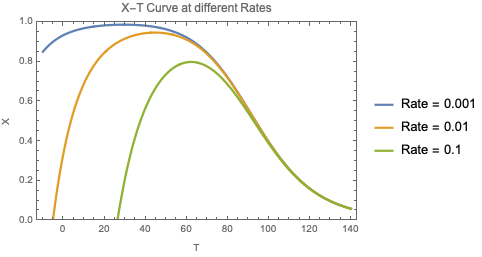
enter image description here

POSTED BY: Rohit Namjoshi

Hi Rohit

I cannot thank you enough for helping me,

You have presented very useful and practical points. It helped me a lot as a beginner in Mathematica.

Thank you very much, I wish you health and happiness.

Posted 4 years ago

Adel:

Before trying to get things to work in Manipulate, I suggest getting them to work with the minimum amount of code first.

Since you want to graph functions, I suggest sticking with Plot[]. Here is an example:

f[x_?NumericQ, n_Integer] := n * x;

Plot[{f[x, 2], f[x, 3], f[x, 4]}, {x, 0, 10}, 
 PlotRange -> {{0, 10}, {0, 20}}]

Keep in mind that Plot[] has many options to customize the look.

Have a great and safe holiday.

POSTED BY: Mike Besso

You're right Mike, I'm trying to rewrite the codes,

Thank you very much for your help.

Posted 4 years ago

Adel:

I think there are at least two options:

  • The documentation for Show[] provides a couple of "Basic Examples" that combine multiple plots.
  • The Plot functions accept both a single function or data argument, or a list of functions or data arguments. For an example, check out Plot[].

I hope that helps.

Have a great and safe holiday.

POSTED BY: Mike Besso

Hi Mike Thank you very much, your answer is completely principled and correct. Do you have any comment on the file I attached? I want to graph a Function(Rate) with two or more different values( for example 0.001, 0.005) ​​at the same time.

Thanks for your kindness

Reply to this discussion
Community posts can be styled and formatted using the Markdown syntax.
Reply Preview
Attachments
Remove
or Discard