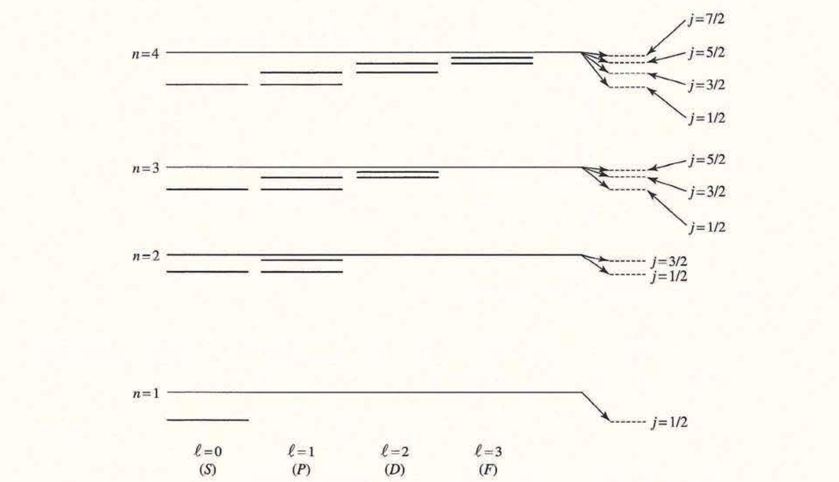
I was thinking that using Graphics and Halfline, but can't get exactly same above figure.
How to plot the energy level figure? is there any command?
Thank you.
Googling "wolfram plot energy levels" gives this as the first result:
https://mathematica.stackexchange.com/questions/223771/plot-an-energy-level-diagram
I hope that helps.
Have a great and safe holiday.