The Raspberry Pi and several DS18B20 temperature sensors can serve as an effective data logger for beehive temperatures.
My initial interest in using: Raspberry Pi, Mathematica, and the DS18B20 was to develop investigations for my students; however, my brother in law is an enthusiastic apiculturist and problem solver. We decided data on temperatures within hives may be useful in the management of
Verroa Destructor, a parasitic mite the has spread among many bee populations worldwide.
This project currently uses two Pi's and four temperature sensors along with Dropbox and CDF Player.
The First Pi acts as a data logger. It is connected to a mains power supply by an extension cord and data is uploaded over a wireless connection to a router. As we both use Windows the SSH client
Putty is useful, along with the Remote Development Control Platform(RDCP). The code running on the Pi is detailed in the post, Reading Temperature Sensors in the Wolfram Language on the RPi. All the technical details about connecting to Dropbox and scripts are contained in that post.
Initially we had issues with the data logger stopping, but the use of the
nohup command solved this.
nohup wolfram -script beemonitor.m &
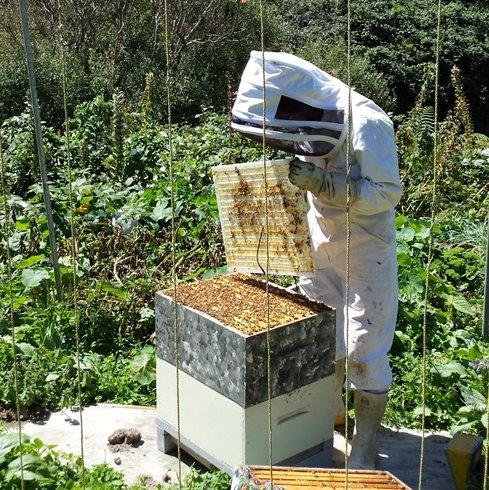
The monitor records temperatures at 5s intervals and uploads into a text file in Dropbox every two minutes. This experiment comes with the proviso "don't try this at home", unless you have experience with bees, because one of the sensors has been placed at the centre of the brood.
The second Pi sits on my desktop and can be accessed from my PC using either Putty or the RDCP. This Pi generates a CDF report by downloading the text file from Dropbox ,sampling the full data set, removing outliers,and plotting. The report is then uploaded. Currently report generation is slow, primarily because of DateListPlot, but speed is not important in this application.
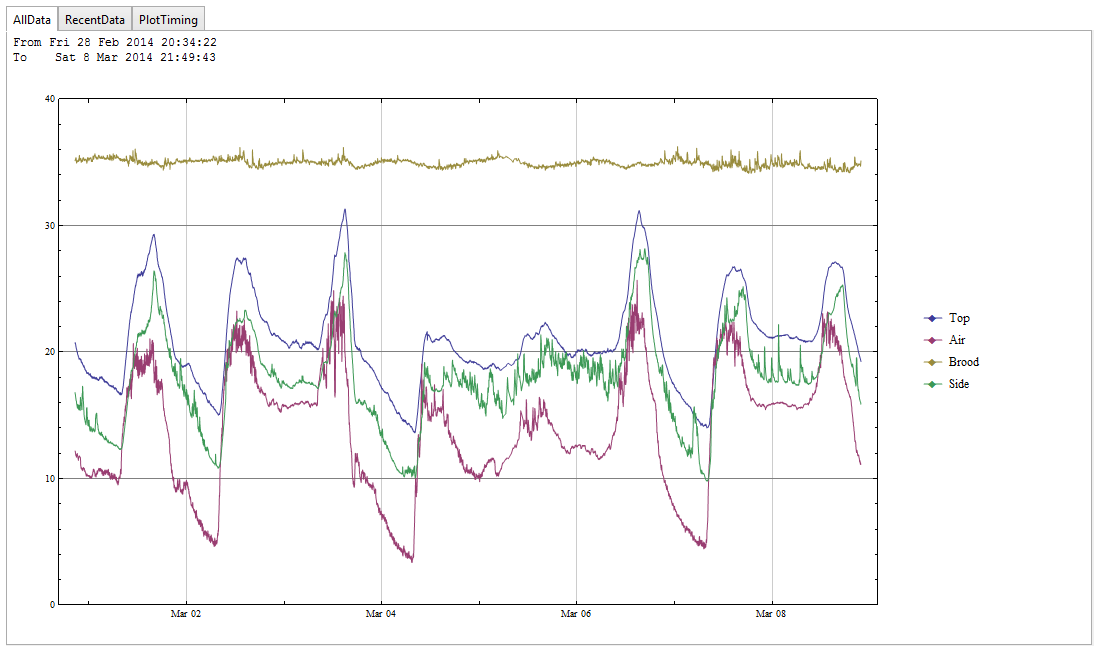
This plot shows that the bees do a very good job of regulating the temperature at the centre of the hive.
The current report, raw data and code can be downloaded.
The next step is time series analysis and I like the look of this new
function, which would make it possible to publish a Bee Volatility Index (
BIX).


