Message Boards Message Boards

1
|
4939 Views
|
10 Replies
|
1 Total Likes
View groups...
Share
Share this post:

Finding piecewise function based on set of points?

Posted 3 years ago

Does anyone know if this is possible? My goal is for my input to be a set of data/2d points ({x0,y0},{x1,y1},...,{xn,yn}) and the output to be some piecewise function. Here's what I mean. I know I can use ListLinePlot to graph all my points and connect them with lines but that seems to be a purely visual tool. I want to know if there's a way to sort of "extract" the equations of those lines such that they form some continuous piecewise function. Obviously it can be done manually but I'm working with sets of hundreds of points. I'm a novice user and haven't yet learned all the ins and outs of Mathematica so any help would be greatly appreciated.

POSTED BY: Jose Hernandez
10 Replies
Posted 3 years ago

@Jim Baldwin I think that may be exactly what I was looking for! Many thanks to you and @Neil Singer. You don't know how much I appreciate it!

POSTED BY: Jose Hernandez
Posted 3 years ago

Hmmm. It looks like Piecewise, Table, and Simplify will do all of the work for you:

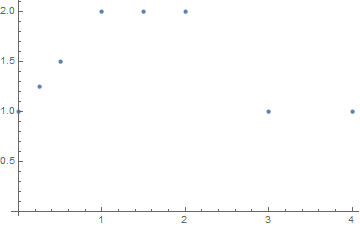
(* Make up some data *)
data = {{0, 1}, {1/4, 5/4}, {1/2, 3/2}, {1, 2}, {3/2, 2}, {2, 2}, {3, 1}, {4, 1}};
data = Sort[data, #1[[1]] <= #2[[1]] &];  (* Make sure it's sorted by the first coordinate *)

(* Define a Piecewise function *)
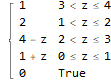
f[x_, data_] := Piecewise[Table[{data[[i - 1, 2]] + (x - data[[i - 1, 1]]) (data[[i - 1, 2]] - data[[i, 2]])/(data[[i - 1, 1]] - data[[i, 1]]) // Expand,
     data[[i - 1, 1]] <= x <= data[[i, 1]]}, {i, 2, Length[data]}]] //Simplify

(* Use function on the data *)
g = f[z, data]

Piecewise function

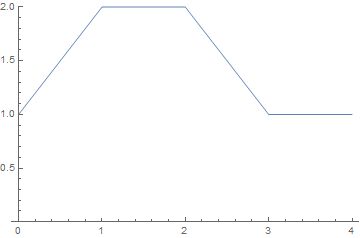
(* Plot the results *)
ListPlot[data]

Data plot

Plot[g, {z, 0, 4}, PlotRange -> {Automatic, {0, Max[data[[All, 2]]]}}]

Piecewise plot

POSTED BY: Jim Baldwin
Posted 3 years ago

I've tried Interpolation and InterpolatingPolynomial. They both work well, but are not quite what I need. I've attached what I hope to achieve. An input of 2d points and an output of a pw function consisting only of linear pieces. So yes, I suppose I am looking for analytical expressions for simple curves. Obviously one could do these by hand but I'd prefer something that does it for me in seconds.

Attachment

Attachments:
POSTED BY: Jose Hernandez
Posted 3 years ago

No, they are not necessarily integers. I merely used those as a very basic example of what I'm looking for.

POSTED BY: Jose Hernandez
Posted 3 years ago

Understood. But I would have to believe that this can't be related to "real data" in that all of the data points in your example consist of integers. Do your sample datasets involve numbers other than integers? (This is part of my question about being real specific.)

POSTED BY: Jim Baldwin

Jose,

  1. @Jim Baldwin makes some good points/suggestions for doing what you want.
  2. Interpolation[] gives a function that you can use like any other function in MMA -- you can integrate or differentiate it, etc. The only problem is it is not analytical. Do you really need an analytical expression for simple segments or arcs through your data?
  3. Look at InterpolatingPolynomial[] -- it will give you the analytical expression for data (probably using similar techniques to Interpolation[]. However, as Jim points out -- you need to understand your data to make best use of this. For example, if your data fits a polynomial well, you will get that polynomial. You can also break the data into "chunks" and use piecewise to construct polynomial sections of your data.
POSTED BY: Neil Singer
Posted 3 years ago

Hello Jim, I'm looking specifically for a piecewise composed solely of linear functions. If my input is n amount of points, my hope is for it to return a pw function with n-1 pieces (or less if more than three consecutive points are colinear though that's not a necessity). My reply to "Neil" has an example of what I'm hoping for. As far as regressions, I'm trying to avoid having to use them though I appreciate the suggestion.

POSTED BY: Jose Hernandez
Posted 3 years ago

Thank you, I wasn't anticipating such a quick response. When I use Interpolate, I see the graph(s) that display the continuous curve that passes through the points but it doesn't display the actual function shown much like ListLinePlot. Ideally, it would return f[x]={...} because I'd like to perform various integrals on f[x]. Also, I need it all to be linear (i.e. order/degree 1). For example, If my input were [{0,1},{1,2},{2,2},{3,1},{4,1}], I would like for the output to be something along the lines of f[x]=Piecewise[{{x+1,0<x<1},{2,1<x<2},{4-x,2<x<3},{1,3<x<4}}]. Maybe I'm just just missing something or maybe I just did it completely incorrectly. Much appreciation!

POSTED BY: Jose Hernandez
Posted 3 years ago

Do you have any restrictions/knowledge about the form that the pieces of the piecewise function can take and (at least roughly) the number pieces? For example, are you looking for a parsimonious number of connected linear or quadratic fits?

If you have no idea about what to expect (and that's not meant to be a slam), then some sort of nonparametric regression might be what you want. Maybe a gam (generalized additive model) or @AntonAntonov 's quantile regression package.

If you could expand on the structure of these datasets, then you would likely get more targeted help.

POSTED BY: Jim Baldwin

Jose,

Interpolation[] will do what you want. It returns a function that is a continuous fit through your data. The documentation has examples.

Regards,

Neil

*Fixed typo in Interpolation[]

POSTED BY: Neil Singer
Reply to this discussion
Community posts can be styled and formatted using the Markdown syntax.
Reply Preview
Attachments
Remove
or Discard

Group Abstract Group Abstract