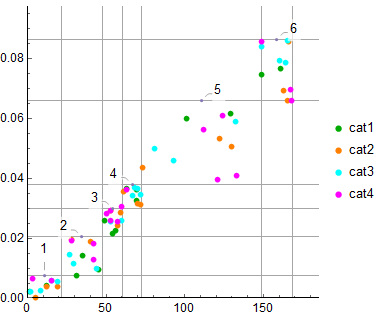
I have some data from 4 different categories, which I've partitioned by values. I'd like to display it in a plot, graphing the partitions as gridlines, the points legended by category, and the partitions themselves labeled with numbers.
My attempt at this was to generate mid-points in the partitions above the data and then replace the midpoints with labels. However, I could not get beyond ListPlot using Callout for labels.
What are some alternatives?
Here's a scaled down simulation of it.
cat1 = {{1, 0.0023}, {12, 0.0042}, {31, 0.0076}, {35, 0.0142}, {45,
    0.0094}, {49, 0.0259}, {54, 0.0217}, {56, 0.0227}, {63,
    0.0367}, {69, 0.0325}, {69, 0.0363}, {101, 0.0599}, {129,
    0.0615}, {149, 0.0746}, {161, 0.0767}};
cat2 = {{5, 0.0002}, {12, 0.0037}, {19, 0.00390}, {28, 0.0194}, {40,
    0.019}, {53, 0.0292}, {57, 0.0242}, {59, 0.0285}, {61,
    0.0357}, {70, 0.0317}, {72, 0.0313}, {73, 0.0435}, {122,
    0.0534}, {130, 0.0507}, {163, 0.0692}, {165, 0.066}, {166,
    0.0857}};
cat3 = {{2, 0.0023}, {8, 0.0025}, {15, 0.006}, {19, 0.00550}, {27,
    0.0147}, {29, 0.0116}, {44, 0.0099}, {53, 0.0255}, {60,
    0.0260}, {67, 0.0344}, {68, 0.0369}, {70, 0.0365}, {72,
    0.0345}, {81, 0.0498}, {93, 0.046}, {132, 0.0590}, {149,
    0.0839}, {160, 0.0792}, {164, 0.0787}, {165, 0.0862}};
cat4 = {{3, 0.0066}, {15, 0.006}, {28, 0.0191}, {42, 0.0128}, {42,
    0.0183}, {50, 0.0284}, {53, 0.0259}, {53, 0.0292}, {57,
    0.0254}, {60, 0.0305}, {63, 0.0361}, {112, 0.0562}, {121,
    0.0396}, {124, 0.0609}, {133, 0.0408}, {149, 0.0858}, {167,
    0.0695}, {168, 0.0661}};

partitions = {{0, 21.5, 47.5, 60.5, 72.5, 148.5, 168.5}, {0., 0.0075,
    0.0205, 0.03, 0.038, 0.066, 0.0865}};
partitionsCount = Length[partitions[[1]]];
partitionLabels =
  Table[{Mean[{partitions[[1, n]], partitions[[1, n + 1]]}],
     partitions[[2, n + 1]]} ->
    Placed[Style[n, {Black, 13}], Center], {n, 1,
    partitionsCount - 1}];

VSP = ListPlot[
   {
    Legended[cat1, Placed[Style["cat1", Black, 13], After]],
    Legended[cat2, Placed[Style["cat2", Black, 13], After]],
    Legended[cat3, Placed[Style["cat3", Black, 13], After]],
    Legended[cat4, Placed[Style["cat4", Black, 13], After]],
    partitionLabels
    },
   PlotStyle -> {{Darker[Green], PointSize[0.02]}, {Orange,
      PointSize[0.02]}, {Cyan, PointSize[0.02]}, {Magenta,
      PointSize[0.02]}, Invisible},
   PlotRange -> {{0, Last[partitions[[1]]] + 2}, {0.,
      1.05*Last[partitions[[2]]]}},
   PlotRangeClipping -> False,
   Axes -> {True, True},
   AxesStyle -> {{Black, 12}, {Black, 12}},
   GridLines -> partitions,
   GridLinesStyle -> {Directive[GrayLevel[0.65], Thin],
     Directive[GrayLevel[0.65], Thin]},
   Ticks -> Automatic,
   AspectRatio -> 1,
   ImageSize -> {320, 320}
   ];
Print[VSP];