Please help me solve a "clipping" issue arising in a Plot I am working on.
Compare these two commands: Definition for the surface surf is at the end on the post.
1.
ContourPlot[surf[y, x], {x, 0, 1024}, {y, 0, 256},
 ColorFunction -> "DarkRainbow",
 PlotRange -> All]
2.
ContourPlot[surf[y, x], {x, 0, 1024}, {y, 0, 256},
 ColorFunction -> "DarkRainbow",
 PlotRange -> {{0, 1024}, {0, 256}}]
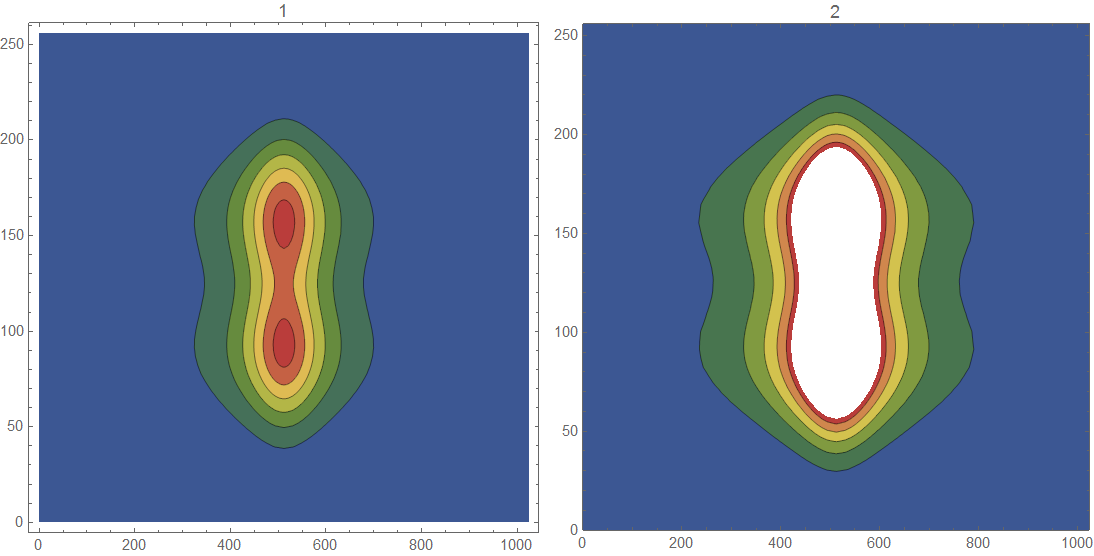
The first one looks fine, you can see all the contours.
But for the second one, some of the contours disappear and the colors turn to white at the center of the plot.
Beside that, plot #1 is not Framed, whereas plot #2 is.
Why is that?
Definition for surf:
A = 800000;
a = 80;
b = 0.0007;
surf = Function[{x, y},
  A (Exp[-b (x - 90)^2] + Exp[-b (x - 90 - 70)^2])/((y - 512)^2 + a^2) ]


