Message Boards Message Boards

0
|
1929 Views
|
4 Replies
|
4 Total Likes
View groups...
Share
Share this post:

Show text above figure's PlotRange

Posted 3 years ago

I want to plot the following plot (this one was done using Windows Paint):

enter image description here

As I see it, we need two Graphics:

g1=Graphics[Text[Framed[Style["256\[Times]256 pixels", 16, Bold], FrameMargins -> 3], {0, 2.5}]]
g2=ContourPlot[Exp[-(x^2 + y^2)], {x, -2, 2}, {y, -2, 2}, GridLines -> {Range[-2, 2, 0.5], Range[-2, 2, 0.5]}]

When I do

Show[{ g1 , g2 } ,
 PlotRange -> {{-2, 2}, {-2, 3}}
 ]

I extended the plot region to be up to 3 in the vertical direction, but it caused g2 to squeeze, which I don't want it to.

enter image description here

I am familiar with PlotLabel, but I don't want to use it, because the figure I am working on has some additional other Graphics elements to be included in it.

Moreover, if Show is the correct function to use, it extends the vertical grid lines (unwanted). How to fix it?

I also tried Overlay. But it just lays g1 on top of g2. Not desired.

Any help?

POSTED BY: Ehud Behar
4 Replies
Posted 3 years ago

Thanks so much again.

Epilog is the function I was looking for.

POSTED BY: Ehud Behar
Posted 3 years ago

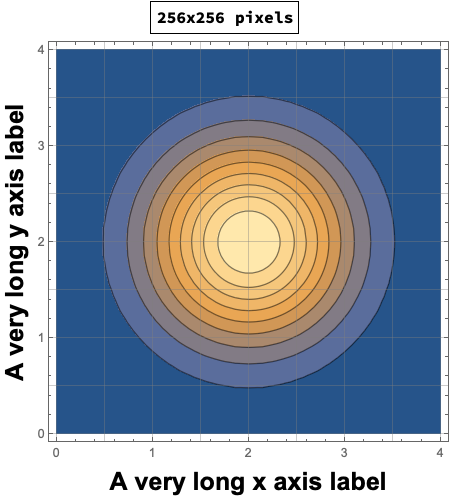
The large multi-line axes labels are quite distracting IMO. A FrameLabel might be a better choice

ContourPlot[Exp[-((x - 2)^2 + (y - 2)^2)], {x, 0, 4}, {y, 0, 4},
  GridLines -> {Range[0, 4, 0.5], Range[0, 4, 0.5]},
  Frame -> True,
  FrameLabel -> (Style[#, 20, Black, Bold] &) /@ {"A very long x axis label", 
     "A very long y axis label"}] // 
 Labeled[#, Framed@Style["256x256 pixels", Bold], Top] &

enter image description here

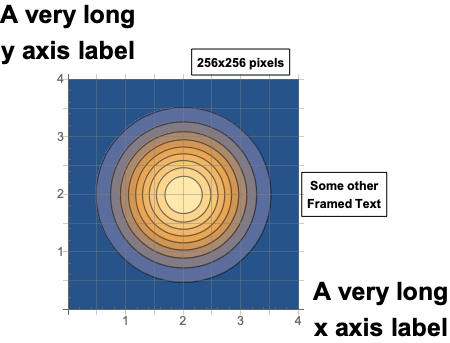
Anyway, you can use Epilog to place any Graphics objects at any location you want. The positions will have to be manually adjusted.

epilog = {
   Inset[Framed@Style["256x256 pixels", Bold], {3.0, 4.3}],
   Inset[Framed@Style["Some other\nFramed Text", Bold], {4.8, 2}]};

ContourPlot[Exp[-((x - 2)^2 + (y - 2)^2)], {x, 0, 4}, {y, 0, 4}, 
 GridLines -> {Range[0, 4, 0.5], Range[0, 4, 0.5]},
 Frame -> False, 
 Axes -> True, 
 AxesLabel -> (Style[#, 20, Black, Bold] &) /@ {"A very long\nx axis label", 
    "A very long\ny axis label"},
 Epilog -> epilog,
 PlotRangeClipping -> False,
 ImagePadding -> All]

enter image description here

POSTED BY: Rohit Namjoshi
Posted 3 years ago

Thanks a lot for your reply, but excuse for modifying "a bit" g1 and g2.

What if g2 is

g2=ContourPlot[Exp[-((x - 2)^2 + (y - 2)^2)], {x, 0, 4}, {y, 0, 4}, 
 GridLines -> {Range[0, 4, 0.5], Range[0, 4, 0.5]}, Frame -> False, 
 Axes -> True, 
 AxesLabel -> 
  Table[Style[j, 20, Black, 
    Bold], {j, {"A very long\nx axis label", 
     "A very long\ny axis label"}}]]

Then

g2// Labeled[#, Framed@Style["256\[Times]256 pixels", 16, Bold], Top] &

which yields

enter image description here

But I want to have control over where the text is positioned, for example with these two text frames:

enter image description here

POSTED BY: Ehud Behar
Posted 3 years ago
g2 // Labeled[#, Framed@Style["256x256 pixels", Bold], Top] &

enter image description here

POSTED BY: Rohit Namjoshi
Reply to this discussion
Community posts can be styled and formatted using the Markdown syntax.
Reply Preview
Attachments
Remove
or Discard

Group Abstract Group Abstract