Suppose I have this plot:
Plot[Sin[x], {x, 0, 10}, GridLines -> {None, {-1/2, 0, 1/2}}]
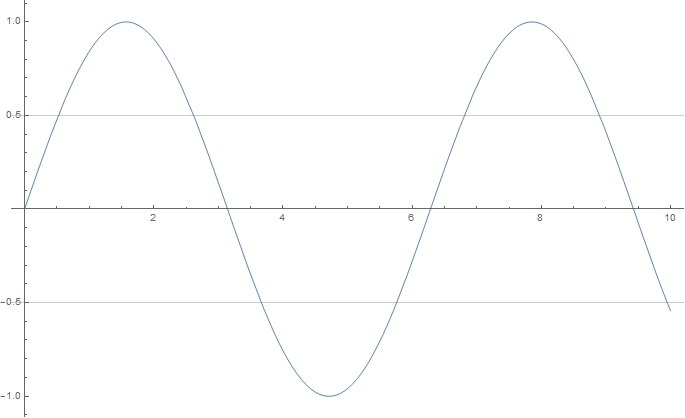
Looks fine isn't it?
Take a closer look at the y-ticks:
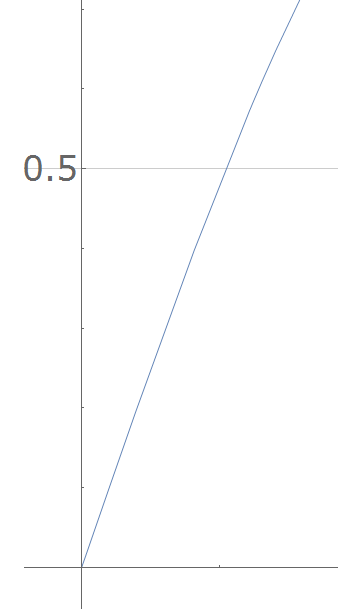
The grid line is continuing on to minus infinity (and to plus infinity too) and lays over the tick label.
The effect is not that bad in this case, it is just a gray thin line, but I want to find a way to fix it, so the grid line extends from exactly 0 to exactly 10.
The doc to GridLines says
For each direction, the following grid line options can be given:
func a function to be applied to Subscript[x, min], Subscript[x, max] to get the grid line option
I tried
Function[{min, max}, {-1, 1}][-1, 1]
(* {-1, 1} *)
Plot[Sin[x], {x, 0, 10}
 , GridLines -> {None, {{1/2, Function[{min, max}, {-1, 1}][-1, 1]}}}]
Just to see if it works at all, but I got an error message: "Encountered 1 where a directive was expected in the value of GridLines."
I don't understand how to use the pure function, can any one show me an example?
Thanks a lot.


