Hi Lawrence,
If you look at data3 you will see that LifeExpectancy for the Falkland Islands is Missing["NotAvailable"]. BubbleChart should generate a more informative error message that the one it does. Remove from the association any keys that have missing values and then plot.
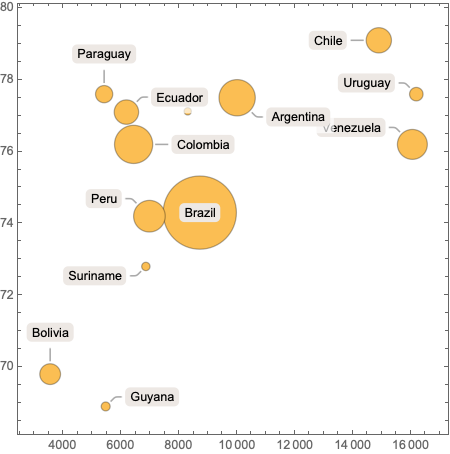
data3 // Select[FreeQ[#, _Missing] &] //
 BubbleChart[#, ChartLabels -> Callout[Keys@#]] &