TSP Art
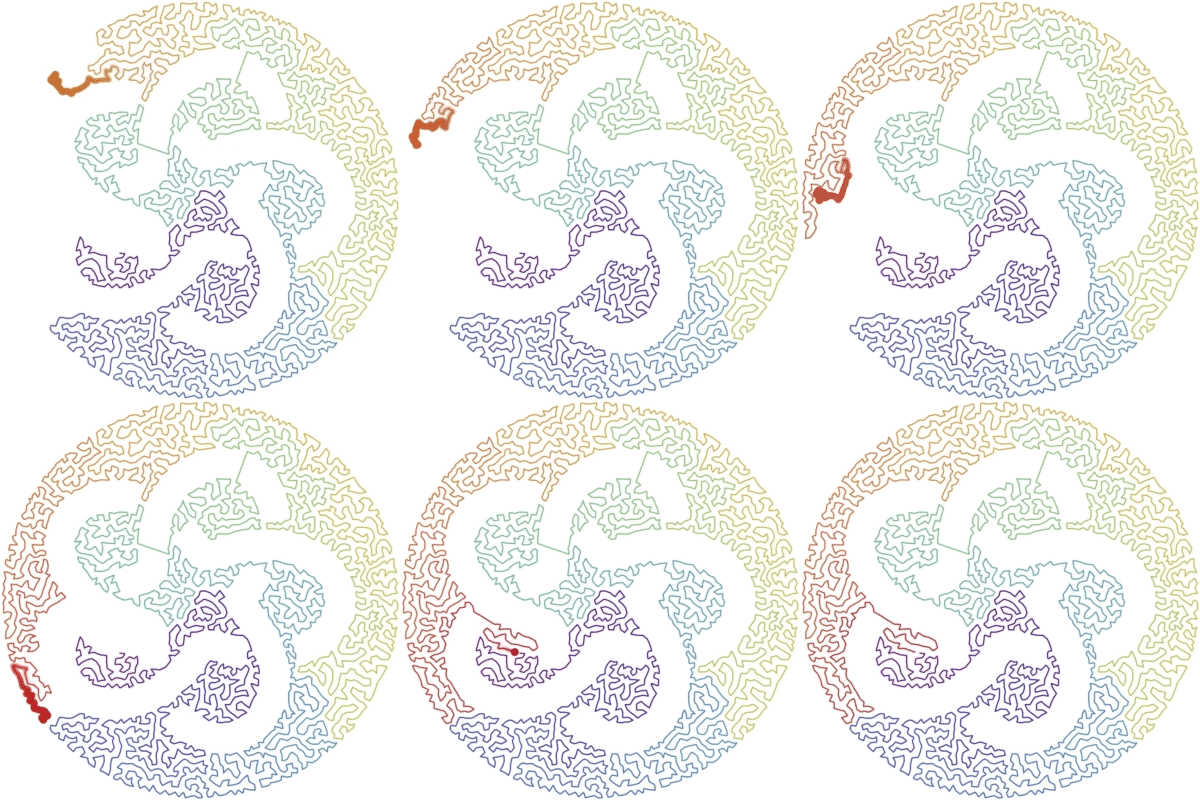
Let's see how to generate the below animation using the Travelling salesman problem (TSP).
The below gif is just an extract of the full animation with a reduced size.
The 2 notebooks are attached at the end of this post.
Generating the knot
The standard knot diagrams are too thin for the algorithm.
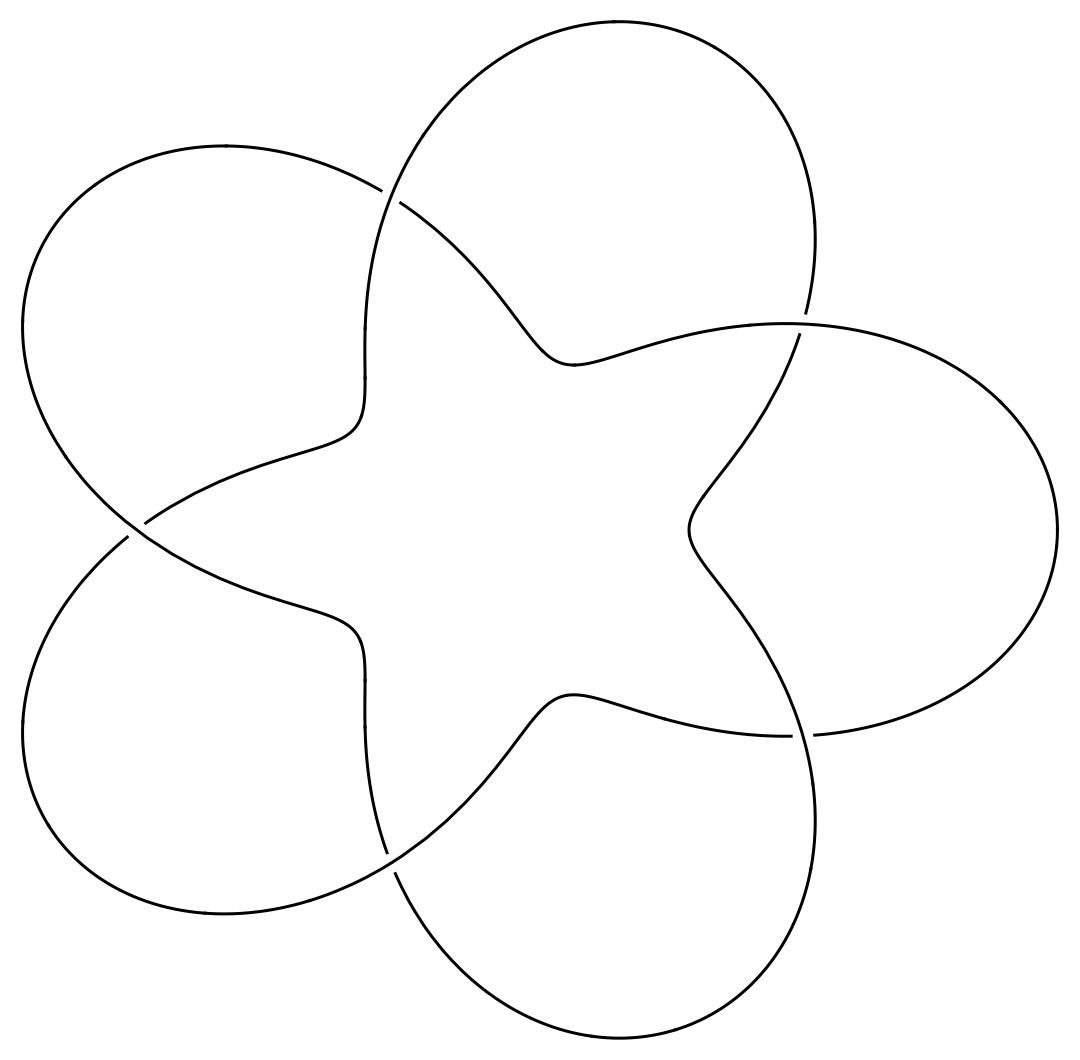
The notebook KnotFormatting.nb is providing some code (using FrenetSerretSystem) to format the diagram and get:

Once we have a picture like that, we can use the other notebook to generate the animation.
Random Points
First we need to generate some random points for the TSP algorithm.
Module[{values, wpts, somePts, w, h, positions, n},
 n = 5000;
 values = Flatten[ImageData[img]];
 {w, h} = ImageDimensions[img];
 positions =
  Flatten[Table[{col, row}, {row, 0, h - 1}, {col, 0, w - 1}], 1];
 wpts = values -> positions;
 somePts = RandomChoice[wpts, n];
 Graphics[{PointSize[0.003], Point[somePts]}]
 ]
If we simply generate random points using the gray levels of the picture, we get something which is not looking very good :
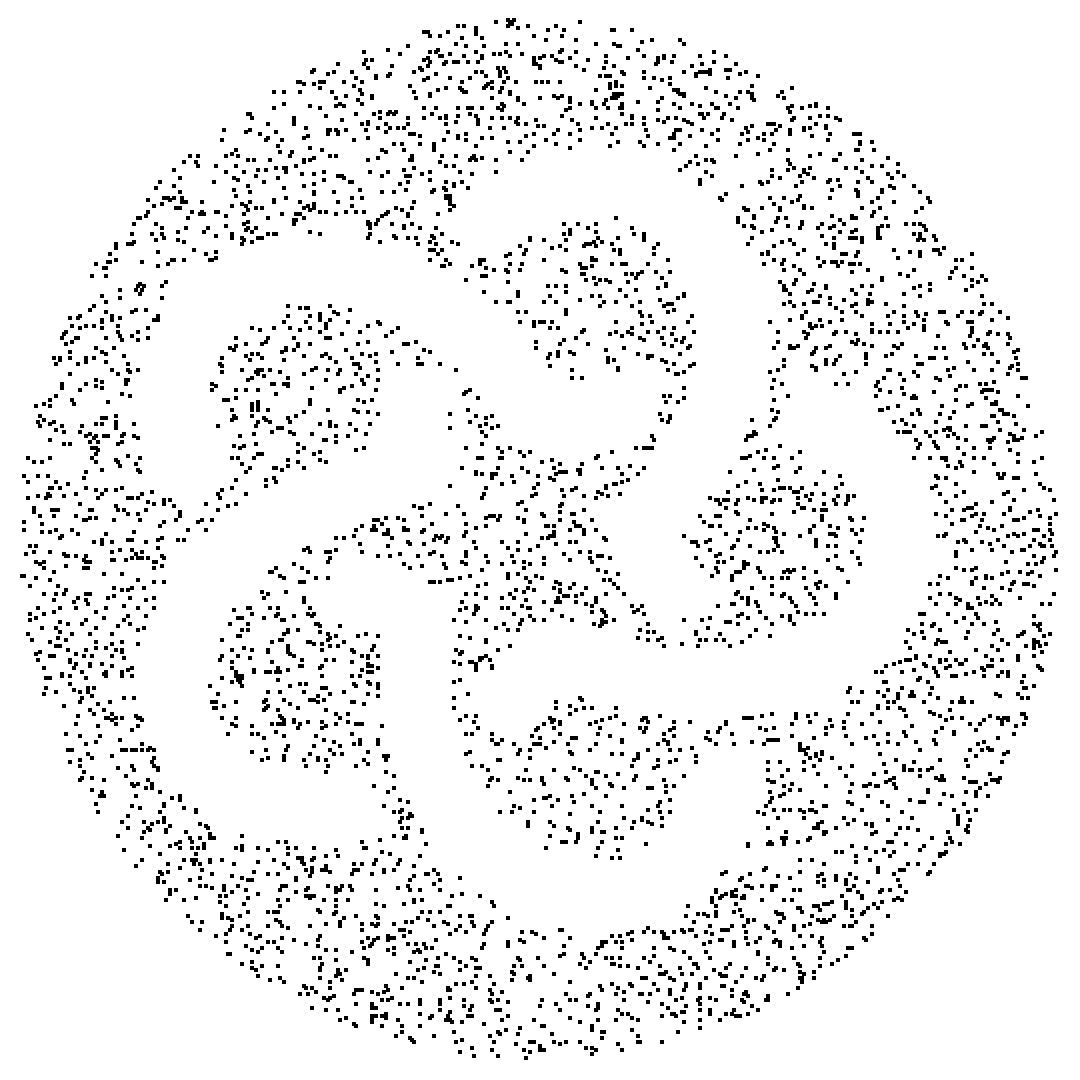
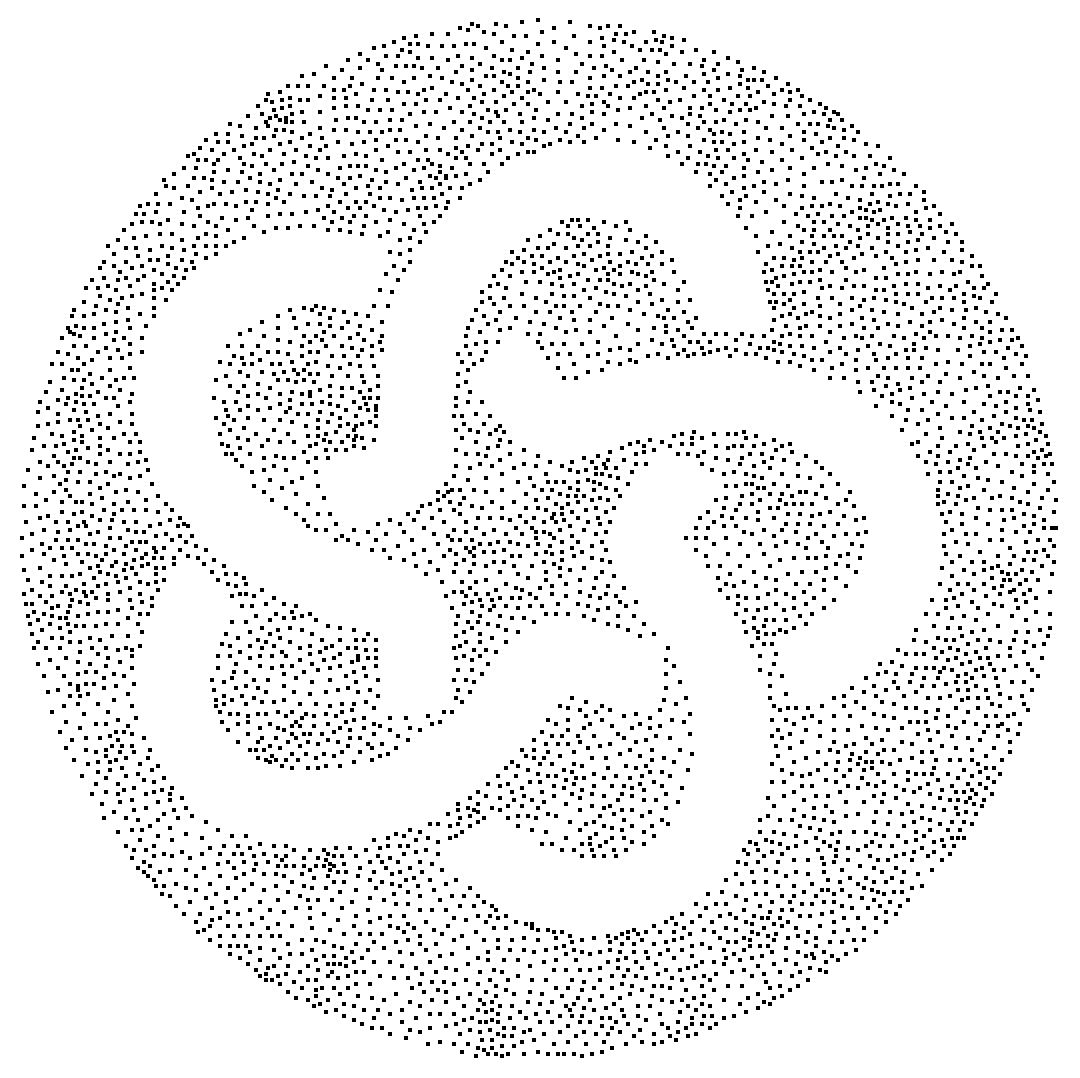
We are using those initial points but modifying their positions. New random points (attractors) are generated following the grayscale distribution. The point we found the closest to a new attractor is moved towards the attractor using a weighted average between the positions of both points. The weight of the point is increased after it is moved. So, a point which is moved often is less and less sensitive to the new attractor points which are generated.
If we apply this method to the previous picture, we get something like:
pts = genPts[q, 5000, "BeamFactor" -> 30];
Graphics[{PointSize[0.003], Point[pts]}]
Now, we can find a path through all those points. There is nothing new here. An example for the function FindShortestTour is doing some TSP Art.
path = genPath[pts];
result = path /. Line -> BSplineCurve // Graphics
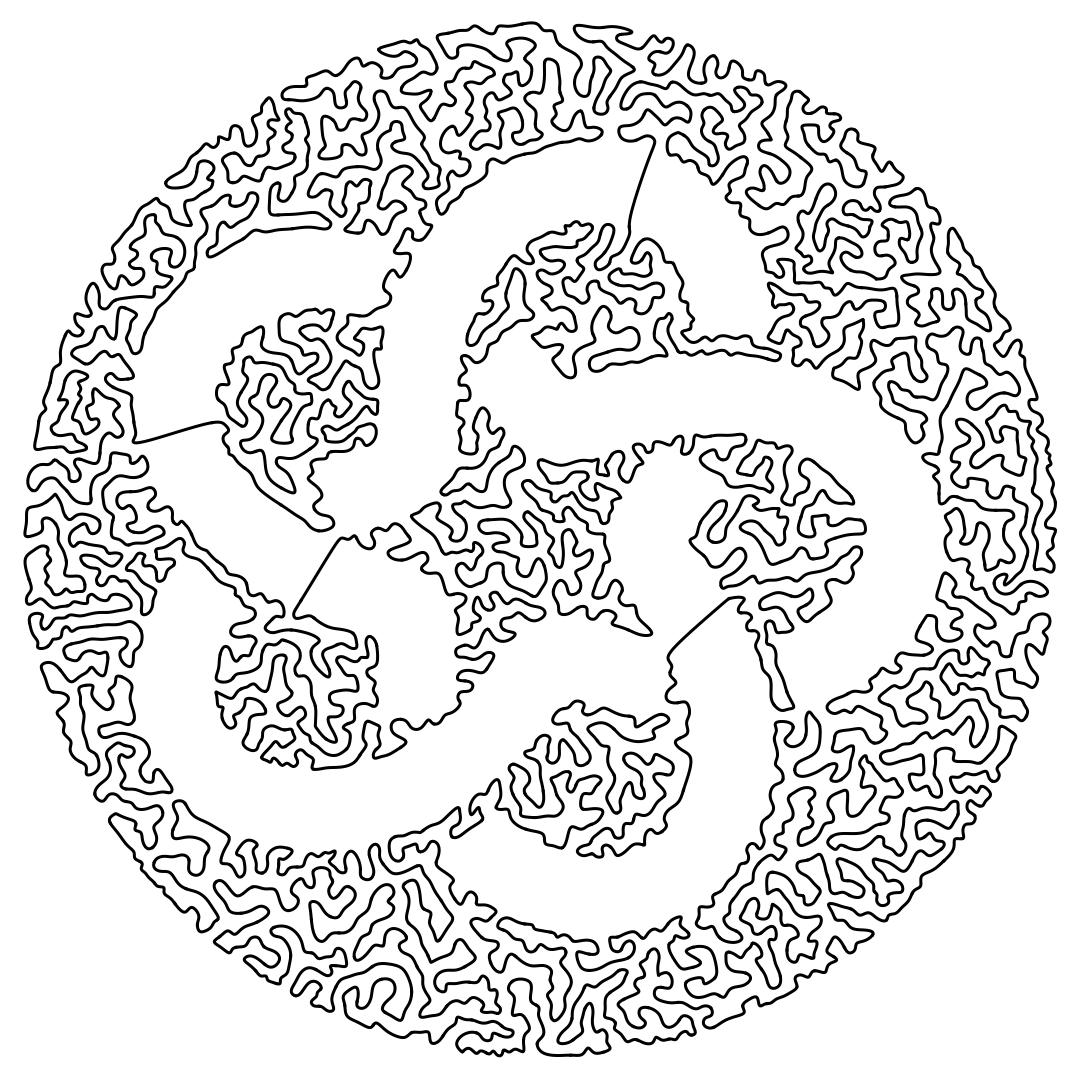
For the animation, we are computing a trajectory using interpolation. This trajectory is using the length as a parametrization. And we compute the maximum length to give an idea of how long the animation will have to run.
If the initial picture was colored, we can also compute a color function to color the curve.
The notebook is defining a frame function which is using the interpolated functions for position and colors.
Here is the last frame in the animation:
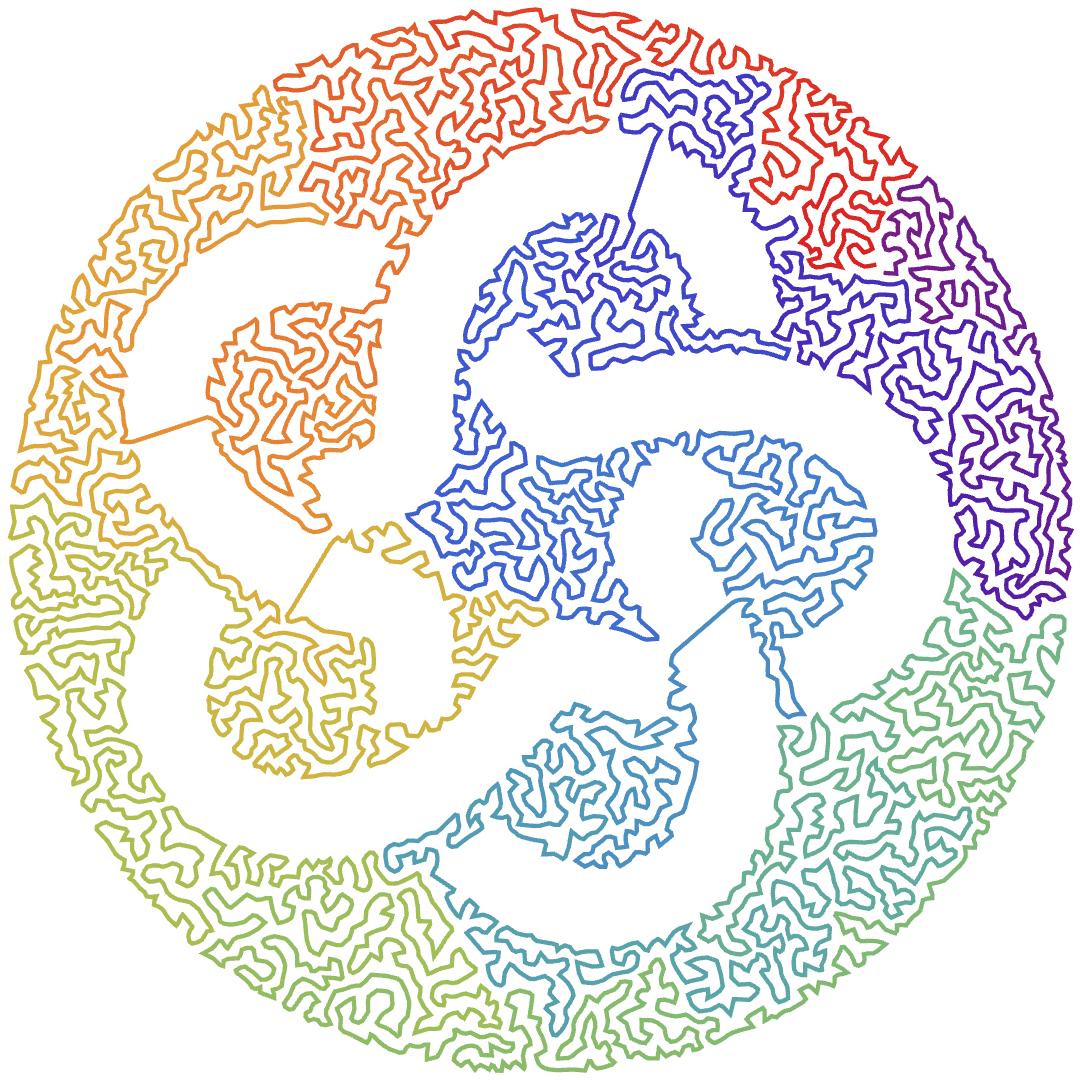
Now, we can generate the final animation:
VideoGenerator[frame[maxTime, ColorData["Rainbow"]], maxTime + 3,
 RasterSize -> 1000, FrameRate -> 30,
 GeneratedAssetLocation ->
  FileNameJoin[{$HomeDirectory, "Downloads"}]]
 Attachments: