An alternative to the Histogram that would elevate you to the 21st century is the nonparametric density estimate. Two advantages is that you wouldn't have to do any calculations to determine the overall range and each can be viewed without obstruction when placed on the same figure (unlike overlapping histograms).
SeedRandom[12345];
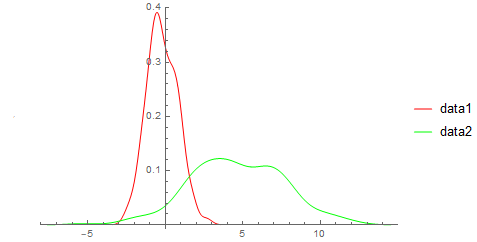
data1 = RandomVariate[NormalDistribution[0, 1], 100];
data2 = RandomVariate[NormalDistribution[5, 3], 200];
Show[SmoothHistogram[data1, Automatic, "PDF", PlotStyle -> Red],
SmoothHistogram[data2, Automatic, "PDF", PlotStyle -> Green,
PlotLegends -> LineLegend[{Red, Green}, {"data1", "data2"}]],
PlotRange -> All]