Hello Henrik,
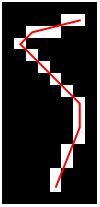
I want a reduction of my line to segments, like a vectorization. So eventually I came up with this code. Maybe someone has a more elegant way of solving this, but it works, as long as it is a line without branching points.
When you skeletonize the object and remove branching points beforehand, the code works fine. Otherwise it generates a mess or errors, unfortunately.
(* example array *)
arr = {{0, 0, 0, 0, 0, 0, 0, 0, 0, 0, 0, 0, 0, 0, 0, 0, 0}, {0, 0, 0,
0, 0, 0, 0, 0, 0, 0, 0, 0, 0, 1, 0, 0, 0}, {0, 0, 0, 0, 0, 0, 0,
0, 0, 0, 0, 0, 1, 0, 1, 0, 0}, {0, 0, 0, 0, 0, 0, 0, 0, 0, 0, 0,
1, 0, 0, 1, 0, 0}, {0, 1, 1, 0, 0, 0, 0, 0, 0, 0, 1, 0, 0, 0, 1,
0, 0}, {0, 0, 0, 1, 1, 0, 0, 0, 0, 1, 0, 0, 0, 0, 0, 1, 0}, {0, 0,
0, 0, 0, 1, 1, 1, 1, 0, 0, 0, 0, 0, 0, 1, 0}, {0, 0, 0, 0, 0, 0,
0, 0, 0, 0, 0, 0, 0, 0, 0, 0, 0}};

(* removes one point from each end and sows point *)
prune[arr_] :=
 ReplacePart[
  arr, # -> 0 & /@
   Sow[Position[ListConvolve[BoxMatrix[1], arr, {2, -2}, {0}]*arr, 2]]]
(* connects point to nearest end of existing chain *)
chain[c0_, m_] :=
 If[ChessboardDistance[c0[[1]], m] == 1, Prepend[c0, m], Append[c0, m]]
(* repeatedly cuts ends and connects them all together *)
lin[arr_] :=
 (
  ends = Flatten[Reap[FixedPoint[prune, arr]][[2]], 2];
  Fold[chain, {ends[[-1]]}, Drop[Reverse[ends], 1]]
  )

(* calculate distance of point from line segment, found in \
Mathematica commuity example *)
d[a_, b_, p_] :=
  If[a == b,
   Norm[p - a], {pz, az, bz} = Map[First[#] + Last[#] I &, {p, a, b}];
    z = (pz - az)/(bz - az);
   If[Not[0 <= Re[z] <= 1], Min[Norm[p - a], Norm[p - b]],
    Norm[Im[z] (b - a)]]];
(* split line into two at biggest distance point, if this distance is \
bigger than 0.5 *)
splt[pts_] :=
 (
  dlst = N[d[pts[[1]], pts[[-1]], #] & /@ pts];
  p0 = Ordering[dlst, -1][[1]];
  If[dlst[[p0]] > 0.5, {Take[pts, p0], Drop[pts, p0 - 1]}, {pts}]
  )
(* flatten array with point lists *)
spltl[ptsl_] := Flatten[splt /@ ptsl, 1]
(* split list until no further change, remove double intermediates *)
lred[pts_] := Append[#[[1]] & /@ FixedPoint[spltl, {pts}], pts[[-1]]]


(* now initial split is done, then refinement of points by wiggling \
left and right *)
(* total distances in one line segment *)
sd[pts_, n1_, n2_] :=
 Plus @@ (d[pts[[n1]], pts[[n2]], #]^2 & /@
    pts[[Range[n1 + 1, n2 - 1]]])
(* total distances in whole line *)
ssd[pts_, nlst_] :=
 Plus @@ (sd[pts, #[[1]], #[[2]]] & /@ Partition[nlst, 2, 1])
(* wiggle each intermediate point by one left and right, find point \
list that has the minimal sum *)
ptssm[pts_, nlst_] :=
 (
  l0 = {nlst};
  (AppendTo[l0, ReplacePart[nlst, # -> nlst[[#]] - 1]];
     AppendTo[l0, ReplacePart[nlst, # -> nlst[[#]] + 1]]) & /@
   Range[2, Length[nlst] - 1];
  SortBy[l0, ssd[pts, #] &][[1]]
  )
(* repeat until no further change *)
lred1[pts_] := (pts0 = N[pts];
  pts0[[FixedPoint[ptssm[pts0, #] &,
    Flatten[Position[pts0, #] & /@ lred[pts0]]]]])

Graphics[{Raster[Transpose[arr]], Red, Thick,
  Line[# - {0.5, 0.5} & /@ lred1[lin[arr]]]}, ImageSize -> 100]

I hope that someone might find this useful.
Best,
Max