Group Abstract Group Abstract

Message Boards Message Boards

0
|
2.6K Views
|
2 Replies
|
2 Total Likes
View groups...
Share
Share this post:

Make a plot having two y-axes with data of different sizes

I need to know how to make a plot with two independent y-axes. One on the left with a plot range of 100, and one on the right with a plot range of 1o^8 {a log plot) but both having the same x-axis. How can I do that with Mathematica? I will appreciate the help on this. -Fred Mayer

POSTED BY: Fred Mayer
2 Replies

Hi Rohit, Thank you very much! Great help! Fred Mayer

POSTED BY: Fred Mayer
Posted 4 years ago

Hi Fred,

Take a look at CombinePlots from the function repository.

From the documentation

ResourceFunction["CombinePlots"][
 Plot[x^2, {x, 0, 10}, Frame -> True],
 Plot[100 x^4, {x, 0, 10},
  ScalingFunctions -> "Log",
  Frame -> True, FrameStyle -> Red, PlotStyle -> Red],
 "AxesSides" -> "TwoY"]
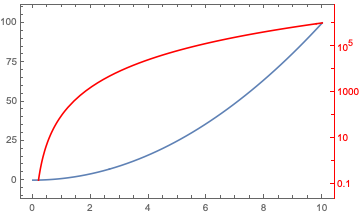
enter image description here

POSTED BY: Rohit Namjoshi
Reply to this discussion
Community posts can be styled and formatted using the Markdown syntax.
Reply Preview
Attachments
Remove
or Discard