Group Abstract Group Abstract

Message Boards Message Boards

0
|
5.6K Views
|
3 Replies
|
8 Total Likes
View groups...
Share
Share this post:

Automatically factoring the axes ticks

Posted 4 years ago

I have the following plot:

Plot[Sin[x], {x, 0, 2 \[Pi]}]

which I want to turn into the following:

enter image description here

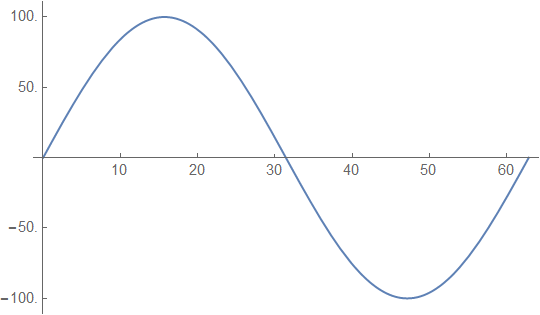
That is, multiply by some factor the automatic ticks.

The above plot was generated using the ticks option: tick marks drawn with the specified labels.

Ticks-> {
{ {1,10} , {2,20} , {3,30} , ...},
{ {0.5, 50} , {1,100} ,...}
}

I am looking for a faster way to do that. Of course I can generate a table of numbers, in this case Table[{i, 100 i}, {i, -1, 1, 0.5}] for the y axis, but I would like to have a way to just multiply "thelabel" by some number (I am working on a more complicated plot).

Thanks!

POSTED BY: Ehud Behar
3 Replies

For this particular plot you can also do it this way:

Plot[100 Sin[x/10], {x, 0, 10*2 Pi}]
POSTED BY: Gianluca Gorni
Posted 4 years ago

Hi Ehud,

This is probably the easiest way to do it. Change xScale and yScale to whatever you want.

xScale = 10; yScale = 100;
ticks = {Charting`ScaledTicks[{# / xScale &, # * xScale &}], 
         Charting`ScaledTicks[{# / yScale &, # * yScale &}]};

Plot[Sin[x], {x, 0, 2 \[Pi]}, Ticks -> ticks]

enter image description here

POSTED BY: Rohit Namjoshi

Maybe you want something like this..

Reply to this discussion
Community posts can be styled and formatted using the Markdown syntax.
Reply Preview
Attachments
Remove
or Discard