Message Boards Message Boards

A question about Periodogram

Posted 4 years ago

Hi, enter image description here

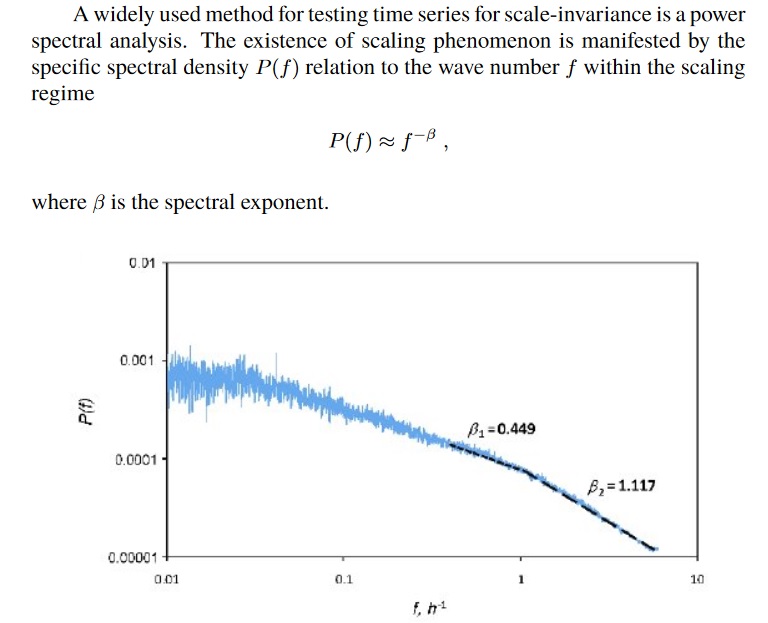
Now I would like to calculate the value of spectral exponent for my data in the attached notebook. Thank you for your help.

data0 = WeatherData["KDRA", 
   "Temperature", {{1979, 1, 1}, {2020, 12, 31}, "Day"}];

regularData = 
  TimeSeriesResample[data0, 
   ResamplingMethod -> {"Interpolation", InterpolationOrder -> 1}];

data = QuantityMagnitude[regularData["Values"]];

Periodogram[data]
POSTED BY: Alex Teymouri
3 Replies

You can use PeridogramArray, then take the first half of the resulting series. Remove the first two or three values from this series. And make an adjustment to this last series. Try this program :

data1 = Take[PeriodogramArray[data], (Length[data]/2)]
data2 = Drop[data1, 2]
model = LinearModelFit[data2, x, x]
mo = Normal[model]
pente = mo[[2, 1]]

You can also read my book Fractal Geography

POSTED BY: André Dauphiné

You can have somme information in my web site about the treatment of temporel datas

https://dauphinester.wixsite.com/monsite/dossiermathematica

POSTED BY: André Dauphiné
Posted 4 years ago

Thank you, Andre. The link was very useful.

I got the following results. What do you think about these two plots?

How can I calculate the slope (or slopes) of the periodogram? enter image description here

POSTED BY: Alex Teymouri
Reply to this discussion
Community posts can be styled and formatted using the Markdown syntax.
Reply Preview
Attachments
Remove
or Discard

Group Abstract Group Abstract