Message Boards Message Boards

0
|
3974 Views
|
5 Replies
|
1 Total Likes
View groups...
Share
Share this post:

Plot issue with the astronomical I choose?

Posted 3 years ago

In the attached figure, I am plotting the angle used in a book exactly with the same parameters with same units, but I am getting a totally different graph values. I am unable to solve it, kindly sort it out. enter image description here
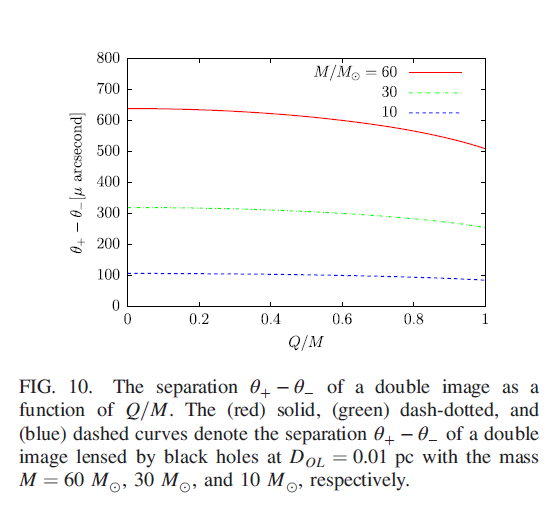
The codes I am using are stated as below

Double angle theta:


rm = 1/2 (3 M + Sqrt[9 M^2 - 8 Q^2]);
bc = rm^2/Sqrt[rm M - Q^2];

\!\(\*OverscriptBox[\(a\), \(_\)]\) = rm/Sqrt[-4 Q^2 + 3 M rm];

\!\(\*OverscriptBox[\(b\), \(_\)]\) = 
  rm/Sqrt[-4 Q^2 + 3 M rm] ( 
     Log[(8 (-4 Q^2 + 3 M rm)^3)/(
       M^2 rm ^2 (-Q^2 + M rm)^2) (2 Sqrt[-Q^2 + M rm] - 
         Sqrt[-4 Q^2 + 3 M rm])^2]) - \[Pi];


\[Beta] = 0; DOL = 0.01; M = 10; Theta = 2 bc/DOL (1 + E^((
\!\(\*OverscriptBox[\(b\), \(_\)]\) - \[Pi] + \[Beta])/
\!\(\*OverscriptBox[
StyleBox["a",
FontSize->12], \(_\)]\)));

\[Beta] = 0; DOL = 0.01; M = 30; Theta1 = 2 bc/DOL (1 + E^((
\!\(\*OverscriptBox[\(b\), \(_\)]\) - \[Pi] + \[Beta])/
\!\(\*OverscriptBox[
StyleBox["a",
FontSize->12], \(_\)]\)));


\[Beta] = 0; DOL = 0.01; M = 60; Theta2 = 2 bc/DOL (1 + E^((
\!\(\*OverscriptBox[\(b\), \(_\)]\) - \[Pi] + \[Beta])/
\!\(\*OverscriptBox[
StyleBox["a",
FontSize->12], \(_\)]\)));


Plot[{Theta, Theta1, Theta2}, {Q , 0, 1}, PlotRange -> All, 
 PlotStyle -> {{Black}, {Red, Dotted}, {Blue, Dashed}, {Green, DotDashed}}, 
 FrameLabel -> {"\!\(\*
   StyleBox[\"Q\",\nFontSize->16]\)", "\!\(\*
   StyleBox[\" \!\(\*SubscriptBox[\(\[Theta]\), \
\(+\)]\)-\!\(\*SubscriptBox[\(\[Theta]\), \(-\)]\)[\[Mu] arcsecond]\",\n\
FontSize->16]\)"}, Frame -> True, Axes -> False]

Kindly help me.

POSTED BY: nani khan
5 Replies

Sorry, try this:

With[{u = 1.63}, 
 Plot[{u*M0*Theta[QoverM*M0, M0]/10^4, u*M1*Theta[QoverM*M1, M1]/10^4,
    u*M2*Theta[QoverM*M2, M2]/10^4}, {QoverM, 0, 1}, PlotRange -> All,
   PlotStyle -> {{Blue, Dashed}, {Green}, {Red, Dotted}}, 
  Frame -> True]]
POSTED BY: Gianluca Gorni
Posted 3 years ago

Thank you for reconsidering my request.

POSTED BY: nani khan
Posted 3 years ago

Thank you so much for your valuable time and help.

POSTED BY: nani khan

I get something vaguely similar this way:

rm = 1/2 (3 M + Sqrt[9 M^2 - 8 Q^2]);
bc = rm^2/Sqrt[rm M - Q^2];
abar = rm/Sqrt[-4 Q^2 + 3 M rm];
bbar = rm/Sqrt[-4 Q^2 + 3 M rm] ( 
          Log[(8 (-4 Q^2 + 3 M rm)^3)/(
                M^2 rm ^2 (-Q^2 + M rm)^2) (2 Sqrt[-Q^2 + M rm] - 
                   Sqrt[-4 Q^2 + 3 M rm])^2]) - \[Pi];
Theta[Q_, M_] = 2 bc/DOL (1 + E^((bbar - \[Pi] + \[Beta])/abar));
\[Beta] = 0; DOL = 0.01; M0 = 10; M1 = 30; M2 = 60;

With[{u = 1.63}, 
 Plot[{u*M0*Theta[M0*QoverM]/10^4, u* M1*Theta[M1*QoverM]/10^4, 
   u*M2*Theta[M2*QoverM]/10^4}, {QoverM , 0, 1}, PlotRange -> All, 
   PlotStyle -> {{Blue, Dashed}, {Green}, {Red, Dotted}}, 
  Frame -> True]]
POSTED BY: Gianluca Gorni
Posted 3 years ago

Dear Sir, Whenever I run your program the plot appears to be empty. Are there any extra codes to run it? Kindly help me with it.

POSTED BY: nani khan
Reply to this discussion
Community posts can be styled and formatted using the Markdown syntax.
Reply Preview
Attachments
Remove
or Discard

Group Abstract Group Abstract