Message Boards Message Boards

2
|
8666 Views
|
6 Replies
|
5 Total Likes
View groups...
Share
Share this post:

Legends again and again and again

Posted 10 years ago
I'm using Mathematica to analyze the results of Monte Carlo simulations (done with another tool) and produce graphics to include in a report for a client.
  • ListPlot and similar functions accept PlotLegends, which is a bit inflexible, but works pretty good.

  • Histogram, like ListPlot, will plot multiple data sets. But it won't accept PlotLegends. You can use Legended on the data sets, but you need to write the code to encapsulate each dataset together with its legend inside a Legended function.

  • PairedHistogram would be useful. But it won't accept PlotLegends, and if you use Legended the histograms and the legends are all the same color. You can't tell them apart.
Oh, when will this nightmare end?  Someday it would be nice to put legends in graphics without having to generate a one-page proof of Fermat's Last Theorem as part of the notebook.
POSTED BY: David Keith
6 Replies
Posted 10 years ago

Excellent! Thanks! It is interesting that the structure of ChartStyle does not match the structure of ChartLegends, but they still get matched up.

Wolfies: How about adding some documentation on this?

Best, David

POSTED BY: David Keith
Posted 10 years ago

Hi David, try this

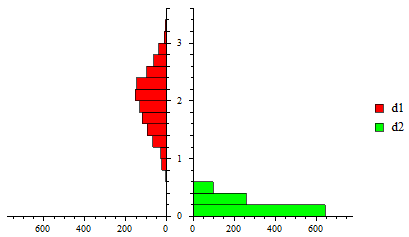
d1 = RandomVariate[NormalDistribution[2, 0.5], 10^3];
d2 = RandomVariate[PowerDistribution[2, 0.5], 10^3];
PairedHistogram[d1, d2, ChartStyle -> {{Red, Green}}, 
 ChartLegends -> {"d1", "d2"}]

enter image description here

POSTED BY: Diego Zviovich
Posted 10 years ago

Which one is d1?

enter image description here

POSTED BY: David Keith

Hi David,

Histogram and PairedHistogram, and actually all other charts, have their own legend option, ChartLegends. You may want to see the individual documentation of functions as well as ChartLegends documentation. It is different from PlotLegends in the sense of that ChartLegends is tied with the depth of datasets while it is unnecessary for PlotLegends.

POSTED BY: MinHsuan Peng
Posted 10 years ago
Thanks very much, Jack. Very useful -- I will keep the notebook around!  And in the second group -- Same plot with custom Legend -- I think you have nearly proven Fermat's conjecture.
For inserting plots, you need to export them as a graphic, and then use the insert picture icon. There's also a guide to posting which floats around -- I see it nearby to these posts now.
Best regards,
David
POSTED BY: David Keith
Hi David, The attached notebook is what I keep handy for easy reference to many Plot and Legend Options. There are too many to remember and they are hard to find in the documentation. They use the new version 9 syntax and are based on an example from WRI tech support (when I had it). This is my first post after just joining the Community. I wanted to paste in the resulting plots, but it didn't work. Perhaps you can tell me how.
Hope this helps you; it sure helps me!

Jack Calman

Attachments:
POSTED BY: Jack Calman
Reply to this discussion
Community posts can be styled and formatted using the Markdown syntax.
Reply Preview
Attachments
Remove
or Discard

Group Abstract Group Abstract