Message Boards Message Boards

0
|
4562 Views
|
2 Replies
|
0 Total Likes
View groups...
Share
Share this post:

Why aren't the lines in my graphs visible?

So whenever I type in Plot, the graph appears but the line does not. I've checked the window size and everything. I'm new to Mathematica so I don't know many options available. I even tried changing its color! Please help if you can! I provided a copy as an attachment for a better description of my problem :-)
Attachments:
POSTED BY: Meagan Williams
2 Replies
Thank you. I actually firgured it out about 2 seconds later, haha. Don't know how to delete forum topics though! Eventually I will figure all of this stuff out!
POSTED BY: Meagan Williams
Hi Meagan,

the syntax was wrong.
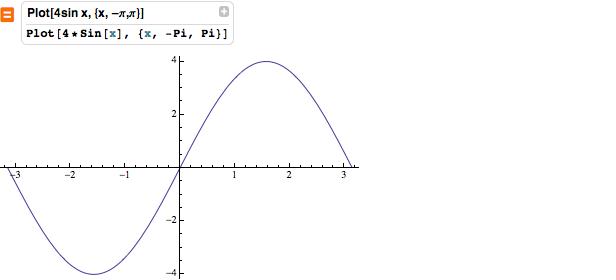
Plot[4 Sin[x], {x, -Pi, Pi}]

will work. 

Built-in functions start with a capital letter and the argument of functions goes into square brackets.

Your way of writing the command does not follow that standard notation, but if you type in an equal sign before everything it will interpret your input and show you the correct syntax as well.


Cheers,
M.
POSTED BY: Marco Thiel
Reply to this discussion
Community posts can be styled and formatted using the Markdown syntax.
Reply Preview
Attachments
Remove
or Discard

Group Abstract Group Abstract