Message Boards Message Boards

1
|
6815 Views
|
7 Replies
|
6 Total Likes
View groups...
Share
Share this post:

Still no way to systematically alter Tick lengths?

If I am reading everything correctly, still the only way to alter tick lengths (axis or frame) from the default is to specify them explicitly. Which has the downside of eliminating the built-in algorithm for deciding which ticks to show. Thickness and color can be specified by, for example, FrameTicksStyle, but length cannot. Can someone please correct me if I'm wrong?

On a related note, following graphics options down the rabbit hole, e.g.,Options[GraphicsBox, DefaultFrameTicksStyle], leads to options with names such as "GraphicsFrameTicks." But there the trail goes cold for me. Does anyone know what that refers to? A hidden set of options or algorithm?

POSTED BY: Gareth Russell
7 Replies
Posted 3 years ago

The following allows easy specification of MinorTicks and MajorTicks.

Clear[MyPlot,MinorTicksBetweenX,MinorTicksBetweenY,NumberMajorTicksX,NumberMajorTicksY,MinorTickLengthX,MajorTickLengthX,MinorTickLengthY,MajorTickLengthY];

Options[MyPlot]=Join[{MinorTicksBetweenX->3,MinorTicksBetweenY->3,NumberMajorTicksX->6,NumberMajorTicksY->6,MinorTickLengthX->{0.012,0},MajorTickLengthX->{0.03,0},MinorTickLengthY->{0.012,0},MajorTickLengthY->{0.03,0}},Options[Plot]];

MyPlot[f_,{x_Symbol,xmin_?NumericQ,xmax_?NumericQ},opts___?OptionQ]:=Module[{numberMajorTicksX,numberMajorTicksY,minorTicksBetweenX,minorTicksBetweenY,minorTickLengthX,majorTickLengthX,minorTickLengthY,majorTickLengthY,plt,ymin,ymax,xmajor,ymajor,xMinor,yMinor,xTicks,yTicks},
  {numberMajorTicksX,numberMajorTicksY,minorTicksBetweenX,minorTicksBetweenY,minorTickLengthX,majorTickLengthX,minorTickLengthY,majorTickLengthY}={NumberMajorTicksX,NumberMajorTicksY,MinorTicksBetweenX,MinorTicksBetweenY,MinorTickLengthX,MajorTickLengthX,MinorTickLengthY,MajorTickLengthY}/.Flatten[{opts,Options[MyPlot]}];
With[{options=FilterRules[Flatten@{opts,Options@MyPlot},Options@Plot]},plt=Plot[f,{x,xmin,xmax},options]];
{ymin,ymax}=Last[PlotRange/.AbsoluteOptions[plt,PlotRange]];
xMajor=FindDivisions[{xmin,xmax},numberMajorTicksX];
yMajor=FindDivisions[{ymin,ymax},numberMajorTicksY];
xMinor=Complement[Subdivide[Min@xMajor,Max@xMajor,(minorTicksBetweenX+1)(Length[xMajor]-1)],xMajor];
yMinor=Complement[Subdivide[Min@yMajor,Max@yMajor,(minorTicksBetweenY+1)(Length[yMajor]-1)],yMajor];xTicks=Join[{#,#,majorTickLengthX}&/@xMajor,{#,"",minorTickLengthX}&/@xMinor];
yTicks=Join[{#,#,majorTickLengthY}&/@yMajor,{#,"",minorTickLengthY}&/@yMinor];
Show[plt,Ticks->{xTicks,yTicks}]]

Then we can do the following:

MyPlot[Exp[x],{x,-3,5},PlotStyle->Red]
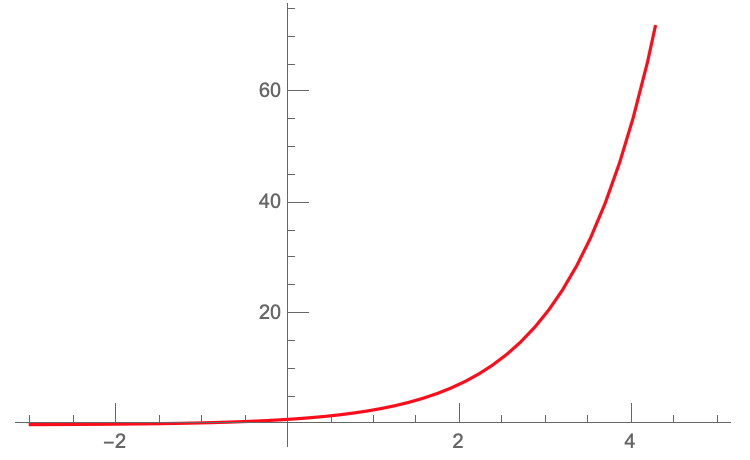
First Example

MyPlot[Exp[x],{x,-3,5},MajorTickLengthX->{0.03,0.02},MinorTickLengthX->{0.015,0.003},PlotStyle->Brown,NumberMajorTicksY->8,MinorTicksBetweenX->4]
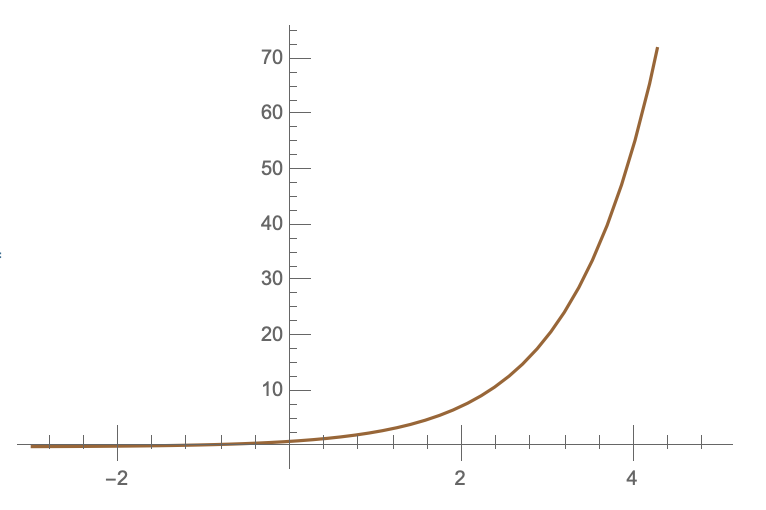
Second Example If you want, you can add other options for the style of the ticks too :) I wasn't able to get this working with the newer OptionsPattern and OptionValue functions. Maybe somebody else can get that working and show what the advantages are of that approach.

POSTED BY: Ted Ersek
Posted 3 years ago

What you want requires a little programming.

MyPlot[f_,{x_Symbol,xmin_?NumericQ,xmax_?NumericQ},opts___?OptionQ]:=Module[{plt,myTicks},
plt=Plot[f,{x,xmin,xmax},opts];
myTicks=AbsoluteOptions[plt,Ticks]/.{val_,labl_,{pos_,neg_},etc_}:>{val,labl,{3 pos,3 neg},etc};
Show[plt,myTicks]
]

That makes the Ticks three time as long. With the right changes to my code, you can get whatever you want. With MyPlot above, you can do the following

MyPlot[Exp[x],{x,-2,3},PlotRange->{0,16},PlotStyle->Red,Ticks->{Automatic,Range[1,16,2]}]

enter image description here Notice I set it up so you can still use the usual options. You can even manually specify where the ticks should be. However, my function above doesn't let you make the tick-marks thicker or a different color. I think that limitation is due to a bug in AbsoluteOptions.

POSTED BY: Ted Ersek

Hi Ted,

Thanks for sharing. Regards,....Jos

POSTED BY: Jos Klaps

Yes, thanks: this is probably the cleanest example I have seen of the "AbsoluteValues" post-plot adjustment. This version is for one plot type, but I don't obviously see why it can't be generalized by having a previously created plot (in this example, plt) be an input. I'll experiment.

I'm still holding out for something like TickLengths->{{majorpos,majorneg},{minorpos,minorneg}} to be built in!

Gareth

POSTED BY: Gareth Russell

Hi Gareth,

If I understand your question correctly, here a few options:

Example 1:

Plot[x^2/5, {x, 0, 10}, 
 Ticks -> {{{2, , .1}, {4, , .2}, {6, "A", .25}, {8, , .15}, {10, 
     2 , .5}}, Automatic}
 , TicksStyle -> Directive[Red, Thick]


 , ImageSize -> Small]

enter image description here

Example 2:

ticksv[min_, max_] := 
 Table[{i, Style[i, 12], {.08, 0}, Thick}, {i, 0, max, 0.2}]
ticksh[min_, max_] := 
 Table[{i, Style[i, 12], {.08, 0}, Directive[Red, Thick]}, {i, 0.5, 
   max, 0.5}]
LogPlot[Exp[-t], {t, 0.0, 2.0}, Ticks -> {ticksh, ticksv}
 , ImageSize -> Small]

enter image description here

Example 3:

Manipulate[
 Plot[Cos[x], {x, 0, 10}, Frame -> True, 
  FrameTicks -> {{{0, 0 \[Degree], {a, b}}, {Pi, 
      180 \[Degree], {a, b}}, {2 Pi, 360 \[Degree], {a, b}}, {3 Pi, 
      540 \[Degree], {a, b}}}, {-1/2, 1/2}}], {a, -0.05, 
  0.05}, {b, -0.05, 0.05}, SaveDefinitions -> True]

enter image description here

Example 4:

dates = DateList[{2002, 1, 2 #}] & /@ Range@600;
values = Accumulate@RandomReal[{-1, 1}, 600];
DateListPlot[Transpose@{dates, values}, Joined -> True, 
 FrameTicks -> {{{#, #, {0, 0.10}} & /@ Range[-30, 30, 2], 
    None}, {Automatic, None}}]

enter image description here

Good luck and regards,.....Jos

POSTED BY: Jos Klaps

I appreciate these examples, but I don't want to explicitly code the ticks every time, I want to be able to change the default tick lengths. One can easily change almost everything else about ticks except their length, which seems like an odd oversight on Wolfram's part.

POSTED BY: Gareth Russell
Posted 3 years ago

I totally agree with you that it will be great if the tick length can be specified in the built-in Plot functions. For now, this package seems a good option. CustomTicks package

POSTED BY: Baker Baker
Reply to this discussion
Community posts can be styled and formatted using the Markdown syntax.
Reply Preview
Attachments
Remove
or Discard

Group Abstract Group Abstract