The following allows easy specification of MinorTicks and MajorTicks.
Clear[MyPlot,MinorTicksBetweenX,MinorTicksBetweenY,NumberMajorTicksX,NumberMajorTicksY,MinorTickLengthX,MajorTickLengthX,MinorTickLengthY,MajorTickLengthY];

Options[MyPlot]=Join[{MinorTicksBetweenX->3,MinorTicksBetweenY->3,NumberMajorTicksX->6,NumberMajorTicksY->6,MinorTickLengthX->{0.012,0},MajorTickLengthX->{0.03,0},MinorTickLengthY->{0.012,0},MajorTickLengthY->{0.03,0}},Options[Plot]];

MyPlot[f_,{x_Symbol,xmin_?NumericQ,xmax_?NumericQ},opts___?OptionQ]:=Module[{numberMajorTicksX,numberMajorTicksY,minorTicksBetweenX,minorTicksBetweenY,minorTickLengthX,majorTickLengthX,minorTickLengthY,majorTickLengthY,plt,ymin,ymax,xmajor,ymajor,xMinor,yMinor,xTicks,yTicks},
  {numberMajorTicksX,numberMajorTicksY,minorTicksBetweenX,minorTicksBetweenY,minorTickLengthX,majorTickLengthX,minorTickLengthY,majorTickLengthY}={NumberMajorTicksX,NumberMajorTicksY,MinorTicksBetweenX,MinorTicksBetweenY,MinorTickLengthX,MajorTickLengthX,MinorTickLengthY,MajorTickLengthY}/.Flatten[{opts,Options[MyPlot]}];
With[{options=FilterRules[Flatten@{opts,Options@MyPlot},Options@Plot]},plt=Plot[f,{x,xmin,xmax},options]];
{ymin,ymax}=Last[PlotRange/.AbsoluteOptions[plt,PlotRange]];
xMajor=FindDivisions[{xmin,xmax},numberMajorTicksX];
yMajor=FindDivisions[{ymin,ymax},numberMajorTicksY];
xMinor=Complement[Subdivide[Min@xMajor,Max@xMajor,(minorTicksBetweenX+1)(Length[xMajor]-1)],xMajor];
yMinor=Complement[Subdivide[Min@yMajor,Max@yMajor,(minorTicksBetweenY+1)(Length[yMajor]-1)],yMajor];xTicks=Join[{#,#,majorTickLengthX}&/@xMajor,{#,"",minorTickLengthX}&/@xMinor];
yTicks=Join[{#,#,majorTickLengthY}&/@yMajor,{#,"",minorTickLengthY}&/@yMinor];
Show[plt,Ticks->{xTicks,yTicks}]]
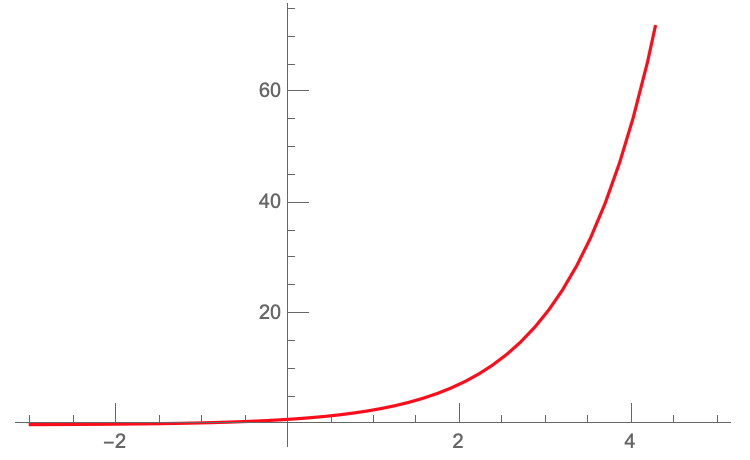
Then we can do the following:
MyPlot[Exp[x],{x,-3,5},PlotStyle->Red]
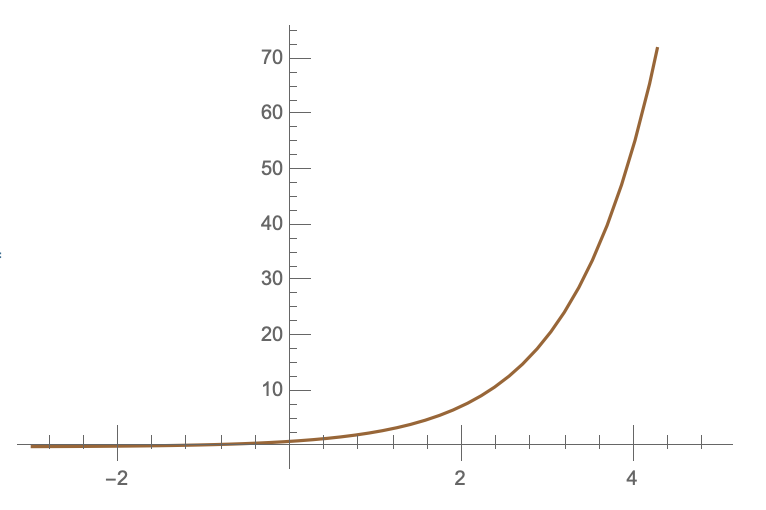
MyPlot[Exp[x],{x,-3,5},MajorTickLengthX->{0.03,0.02},MinorTickLengthX->{0.015,0.003},PlotStyle->Brown,NumberMajorTicksY->8,MinorTicksBetweenX->4]
 If you want, you can add other options for the style of the ticks too :)
I wasn't able to get this working with the newer OptionsPattern and OptionValue functions.
Maybe somebody else can get that working and show what the advantages are of that approach.
If you want, you can add other options for the style of the ticks too :)
I wasn't able to get this working with the newer OptionsPattern and OptionValue functions.
Maybe somebody else can get that working and show what the advantages are of that approach.


