Message Boards Message Boards

1
|
3562 Views
|
5 Replies
|
3 Total Likes
View groups...
Share
Share this post:

How to "clip" GridLines?

Posted 3 years ago

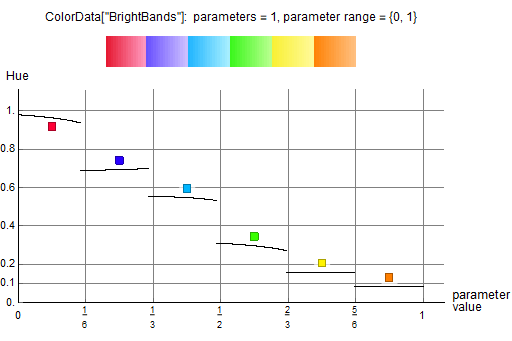
In the example below, the GridLines extend below and to the left of the axes. How to prevent this?

enter image description here

X = 10000;
Xfractions = N[(#/X) & /@ Range[0, X]];
brightBandsXRGBcolors = ColorData["BrightBands"][#] & /@ Xfractions;
brightBandsXHSIcolors = 
  ColorConvert[#, "HSB"] & /@ brightBandsXRGBcolors;
brightBandsXHSIcoords = List @@@ brightBandsXHSIcolors;
brightBandsXH = 
  Thread[List[Xfractions, brightBandsXHSIcoords[[;; , 1]]]];
Xticks = (#/6) & /@ Range[0, 6];
Hticks = {0., 0.1, 0.2, 0.4, 0.6, 0.8, 1.};
plotTitle = 
  Column[{Style[
     "ColorData[\"BrightBands\"]:  parameters = " <> 
      ToString[ColorData["BrightBands", "ParameterCount"]] <> 
      ", parameter range = " <> 
      ToString[ColorData["BrightBands", "Range"]], {Black, 12}], 
    ColorData["BrightBands", "Image"]}, Center, 1];
LPXH = ListPlot[
   brightBandsXH,
   AxesOrigin -> {0, 0.},
   PlotRange -> Full,
   PlotStyle -> {Black, PointSize[0.005]},
   Joined -> False,
   Ticks -> {Xticks, Hticks},
   GridLines -> {Xticks, Hticks},
   GridLinesStyle -> Automatic,
   AxesStyle -> {{Black, 14}, {Black, 12}},
   AxesLabel -> {Column[{Style["parameter", {Black, 12}], 
       Style["value", {Black, 12}]}, Left, 0], 
     Style["Hue", {Black, 12}]},
   PlotLabel -> plotTitle,
   AspectRatio -> 1/3,
   ImageSize -> {512, Automatic}
   ];
Print[LPXH];
POSTED BY: Richard Frost
5 Replies
Posted 3 years ago

An alternative. With a framed plot:

LPXH = ListPlot[
    brightBandsXH,
    PlotRange -> {MinMax[Xticks], MinMax[Hticks]},
    FrameTicks -> {{Hticks, None}, {Xticks, None}},
    GridLines -> {Xticks, Hticks},
    FrameLabel ->
      {
        Style["parameter value", {Black, 13}],
        Style["Hue", {Black, 13}]
      },
    PlotLabel -> plotTitle,
    AspectRatio -> 1/2,
    ImageSize -> {512, 512*2/3},
    PlotRangePadding -> None,
    Frame -> True
  ]

enter image description here

POSTED BY: Hans Milton

Thank you Hans, this was the approach I needed. After adding some padding to the top, a blank line to the title, and repositioning the callout to Above, I received exactly the plot desired. :)

PlotRangePadding -> {{0., 0.}, {0., 0.05}},

enter image description here

POSTED BY: Richard Frost
Posted 3 years ago

Richard, should not the tick marks be swapped?

POSTED BY: Hans Milton

Hah! Good catch. I likely misordered them in FrameTicks.

POSTED BY: Richard Frost

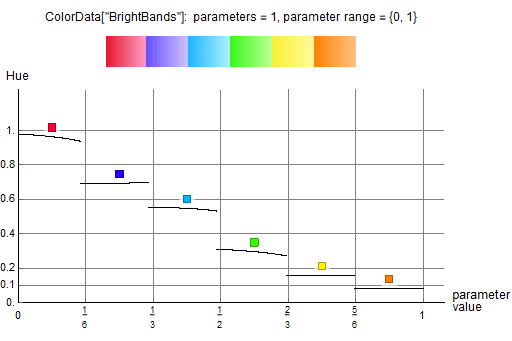
Adding PlotRangeClipping did not help, but adding PlotRange helped a lot

PlotRange -> {MinMax[Xticks], MinMax[Hticks]},

although when callouts were added the problem resurfaced again in the vertical direction above the plot. For now I've compromised by placing the first callout below and the remaining above.

All Above:
enter image description here

vs 1st Below:

enter image description here

X = 10000;
Xfractions = (#/X) & /@ Range[0, X];
Xcallout = Nearest[Xfractions, #/12][[1]] & /@ {1, 3, 5, 7, 9, 11};
brightBandsXRGBcolors = ColorData["BrightBands"][#] & /@ Xfractions;
brightBandsXHSIcolors = 
  ColorConvert[#, "HSB"] & /@ brightBandsXRGBcolors;
brightBandsXHSIcoords = List @@@ brightBandsXHSIcolors;
brightBandsXH = If[
     MemberQ[Xcallout, #[[1]]],
     Callout[#, Hue[#[[2]]], 
      Which[#[[1]] == Xcallout[[1]], Below, True, Above], 
      LeaderSize -> 0],
     #
     ] & /@ Thread[List[Xfractions, brightBandsXHSIcoords[[;; , 1]]]];
Xticks = (#/6) & /@ Range[0, 6];
Hticks = {0., 0.1, 0.2, 0.4, 0.6, 0.8, 1.};
plotTitle = 
  Column[{Style[
     "ColorData[\"BrightBands\"]:  parameters = " <> 
      ToString[ColorData["BrightBands", "ParameterCount"]] <> 
      ", parameter range = " <> 
      ToString[ColorData["BrightBands", "Range"]], {Black, 12}], 
    ColorData["BrightBands", "Image"]}, Center, 1];
LPXH = ListPlot[
   brightBandsXH,
   AxesOrigin -> {0, 0.},
   PlotRange -> {MinMax[Xticks], MinMax[Hticks]},
   PlotRangeClipping -> True,
   PlotStyle -> {Black, PointSize[0.0045]},
   Joined -> False,
   Ticks -> {Xticks, Hticks},
   GridLines -> {Xticks, Hticks},
   GridLinesStyle -> Automatic,
   AxesStyle -> {{Black, 11}, {Black, 11}},
   AxesLabel -> {Column[{Style["parameter", {Black, 13}], 
       Style["value", {Black, 12}]}, Left, 0], 
     Style["Hue", {Black, 12}]},
   PlotLabel -> plotTitle,
   AspectRatio -> 1/2,
   ImageSize -> {512, 512*2/3}
   ];
Print[LPXH];
POSTED BY: Richard Frost
Reply to this discussion
Community posts can be styled and formatted using the Markdown syntax.
Reply Preview
Attachments
Remove
or Discard

Group Abstract Group Abstract