Adding PlotRangeClipping did not help, but adding PlotRange helped a lot
PlotRange -> {MinMax[Xticks], MinMax[Hticks]},
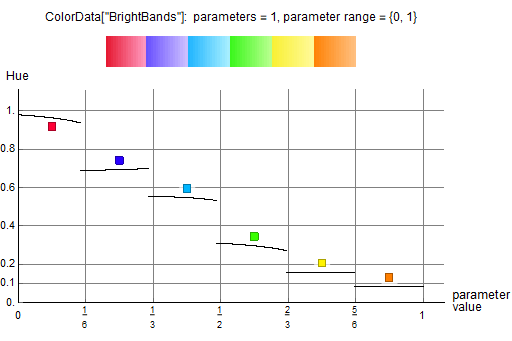
although when callouts were added the problem resurfaced again in the vertical direction above the plot. For now I've compromised by placing the first callout below and the remaining above.
All Above:
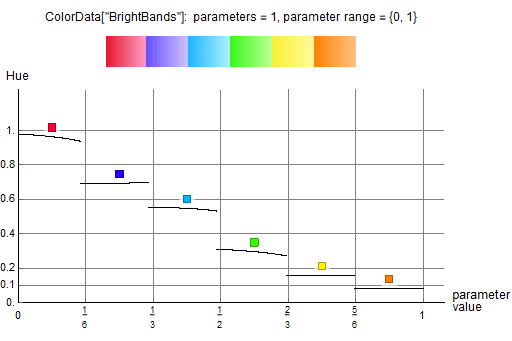
vs 1st Below:
X = 10000;
Xfractions = (#/X) & /@ Range[0, X];
Xcallout = Nearest[Xfractions, #/12][[1]] & /@ {1, 3, 5, 7, 9, 11};
brightBandsXRGBcolors = ColorData["BrightBands"][#] & /@ Xfractions;
brightBandsXHSIcolors =
  ColorConvert[#, "HSB"] & /@ brightBandsXRGBcolors;
brightBandsXHSIcoords = List @@@ brightBandsXHSIcolors;
brightBandsXH = If[
     MemberQ[Xcallout, #[[1]]],
     Callout[#, Hue[#[[2]]],
      Which[#[[1]] == Xcallout[[1]], Below, True, Above],
      LeaderSize -> 0],
     #
     ] & /@ Thread[List[Xfractions, brightBandsXHSIcoords[[;; , 1]]]];
Xticks = (#/6) & /@ Range[0, 6];
Hticks = {0., 0.1, 0.2, 0.4, 0.6, 0.8, 1.};
plotTitle =
  Column[{Style[
     "ColorData[\"BrightBands\"]:  parameters = " <>
      ToString[ColorData["BrightBands", "ParameterCount"]] <>
      ", parameter range = " <>
      ToString[ColorData["BrightBands", "Range"]], {Black, 12}],
    ColorData["BrightBands", "Image"]}, Center, 1];
LPXH = ListPlot[
   brightBandsXH,
   AxesOrigin -> {0, 0.},
   PlotRange -> {MinMax[Xticks], MinMax[Hticks]},
   PlotRangeClipping -> True,
   PlotStyle -> {Black, PointSize[0.0045]},
   Joined -> False,
   Ticks -> {Xticks, Hticks},
   GridLines -> {Xticks, Hticks},
   GridLinesStyle -> Automatic,
   AxesStyle -> {{Black, 11}, {Black, 11}},
   AxesLabel -> {Column[{Style["parameter", {Black, 13}],
       Style["value", {Black, 12}]}, Left, 0],
     Style["Hue", {Black, 12}]},
   PlotLabel -> plotTitle,
   AspectRatio -> 1/2,
   ImageSize -> {512, 512*2/3}
   ];
Print[LPXH];


