Message Boards Message Boards

0
|
3477 Views
|
2 Replies
|
2 Total Likes
View groups...
Share
Share this post:

ListPlot missing point

Posted 3 years ago

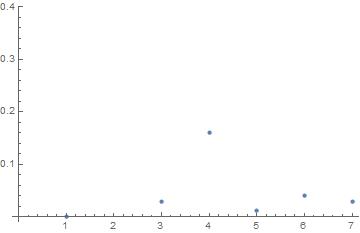
Point with value 0.7 is missing in the plot:

ListPlot[{0.0002, 0.7, 0.03, 0.16, 0.013, 0.04, 0.03}]

plot1

I get a totaly different result when I change the last value in the list from 0.03 to 0.8

ListPlot[{0.0002, 0.7, 0.03, 0.16, 0.013, 0.04, 0.8}]

plot2

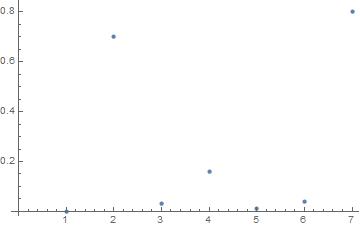
Now point with value 0.7 and 0.8 are present in the plot! I tried to change the AspectRatio and DataRange, no help. What I'am missing?

POSTED BY: Chris Van Damme
2 Replies

Thank you Neil.

POSTED BY: Chris Van Damme

Chris,

You must use PlotRange:

ListPlot[{0.0002, 0.7, 0.03, 0.16, 0.013, 0.04, 0.03}, 
 PlotRange -> All]

Mathematica's algorithm does automatic zooming on plots as a starting point. You can use PlotRange to specify All or an X or Y range (or both).

Regards,

Neil

POSTED BY: Neil Singer
Reply to this discussion
Community posts can be styled and formatted using the Markdown syntax.
Reply Preview
Attachments
Remove
or Discard

Group Abstract Group Abstract