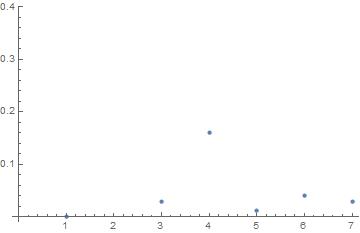
Point with value 0.7 is missing in the plot:
ListPlot[{0.0002, 0.7, 0.03, 0.16, 0.013, 0.04, 0.03}]

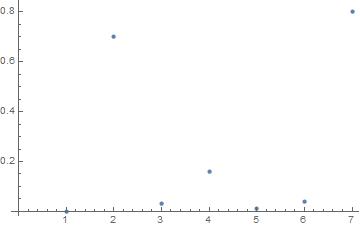
I get a totaly different result when I change the last value in the list from 0.03 to 0.8
ListPlot[{0.0002, 0.7, 0.03, 0.16, 0.013, 0.04, 0.8}]

Now point with value 0.7 and 0.8 are present in the plot! I tried to change the AspectRatio and DataRange, no help. What I'am missing?