Message Boards Message Boards

0
|
13095 Views
|
12 Replies
|
3 Total Likes
View groups...
Share
Share this post:

ParametricPlot with PlotLegends-option

Posted 11 years ago
Hi,

I want to use ParametricPlot  with PlotLegends option. But the samples in the help document do not work as they are expected. Such command as
ParametricPlot[{{2r Cos[t],r Sin[t]},{r Cos[t],2r Sin[t]}},
{t,0,2 Pi},{r,0,1},Mesh->False,PlotLegends->Automatic]

does not yield the right legends. Is there any other way to attach legends to ParametricPlot ?
POSTED BY: Isaka Hiromu
12 Replies

Hi David,

As Bruce mentioned, this issue has been worked on for v10. In the meanwhile, here is a workaround.

ParametricPlot[{{2 r Cos[t], r Sin[t]}, {r Cos[t], 2 r Sin[t]}}, {t, 0, 2 Pi}, {r, 0, 1}, Mesh -> False, 
PlotLegends -> SwatchLegend[1, {"a", "b"}, BaseStyle -> Opacity[0.3]]]
POSTED BY: MinHsuan Peng
Problems with PlotLegends in ParametricPlot are being worked on for a future release.
I do not know when a Mathematica with any specific problem corrected will be released.


Mr. Keith,
The example "PlotLegends -> {{x}, {y}}" in
ParametricPlot[{{2 r Cos[t], r Sin[t]}, {r Cos[t], 2 r Sin[t]}}, {t, 0, 2 Pi}, {r, 0, 1}, Mesh -> False, PlotLegends -> {{x}, {y}}]
does not closely correlate with documented syntaxes.  I am not commenting on that one.   Cute, 'tho.
POSTED BY: Bruce Miller
Posted 11 years ago
Hi Bruce,

Yes -- I agree. Bill Simpson (above) seemed to be saying that it was producing something, but not for me. The only syntax that would be consisten is a list of legends, like Plot would accept. There seems to be something that is keeping ParametricPlot from the usual behavior. Maybe fixed in 10.

I whine a lot about making journal-quality graphics easier, but V10 is a long way up from V2, where you and I got on this train!

Kind regards,
David
POSTED BY: David Keith
Posted 11 years ago
Hi,Mark, Hi,David,
I'm also looking forward to improving this inconvenience by WRI. 
However, I wonder how the results in the documentation of ParametricPlot with PlotLegends option are generated in the first place? 
POSTED BY: Isaka Hiromu
Posted 11 years ago
Legends remain challenging (in my experience). While waiting for resolution of this issue (or perhaps greater insights),  I post this to illustrate/motivate and I am certain people can create more 'interesting' legends, however, that you can customize (in this case SwatchLegend). In this case, the legend marker is created from a user defined 'representative' region and MeshFunctions just used to make 'interesting marker'. 
 fun[f_, {s_, s0_, s1_}, {t_, t0_, t1_}, lab_, mf_, mn_, col_, reg_,
 
   sz_,sc_] := Module[{pl, sw},
 
   pl = MapThread[
 
     ParametricPlot[f, {s, s0, s1}, {t, t0, t1}, MeshFunctions -> mf,
 
       Mesh -> Round[sc mn/sz], PlotStyle -> #2,

      RegionFunction -> #1] &, {reg, col}];

  sw = SwatchLegend[col, lab, LegendMarkers -> pl,

    LegendMarkerSize -> sz ];

  ParametricPlot[f, {s, s0, s1}, {t, t0, t1}, MeshFunctions -> mf,

   Mesh -> mn, PlotStyle -> col, PlotLegends -> sw]]

Example:
 expr = {{2 r Cos[t], r Sin[t]}, {r Cos[t], 2 r Sin[t]}};
 
 fun[expr, {r, 0, 1}, {t, 0, 2 Pi},
 
   TraditionalForm[#] & /@ expr, {#1 + #2 &, #1 - #2 &},
 
   30, {Red,
 
    Blue}, {Function[{x, y, u, v}, 0.5 < x < 1 && -0.2 < y < 0.2],

   Function[{x, y, u, v}, -0.4 < x < 0.4 && 1 < y < 1.5]}, 50,5]
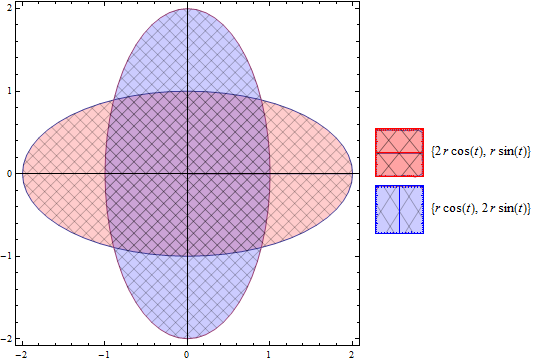


Or
fun[expr, {r, 0, 1}, {t, 0, 2 Pi},

TraditionalForm[#] & /@ expr, {#3 &, #4 &}, 20, {Red,

  Blue}, {Function[{x, y, u, v}, 0.5 < x < 1 && -0.2 < y < 0.2],

  Function[{x, y, u, v}, -0.4 < x < 0.4 && 1 < y < 1.5]}, 40, 15]
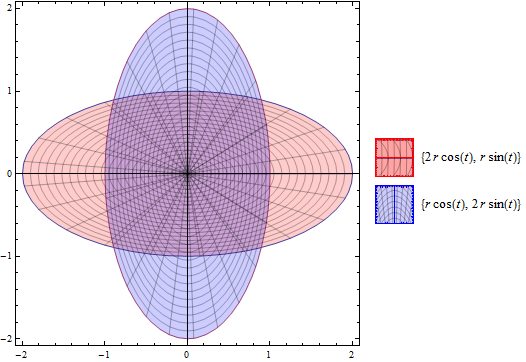


This is not elegant but I post to show work around and capabilities of other approaches. 

A related post here (using similar approach for RegionPlot)


POSTED BY: Mark Dooris
Posted 11 years ago
I see. This is interesting and informative. I'll give it a try on my case. Thanks a lot.
 
POSTED BY: Isaka Hiromu
Posted 11 years ago
Hi Mark,
I am also on 9.0.1.0, on Win 7 Pro x64.

When I open the documentation of ParametricPlot, in a fresh notebook, it gives this example (taken as a screen shot):


When I execute this in place, I get the same plot with no legends:


When I execute your first example, I get this. It appears PlotLegends called from ParametricPlot does not look inside the list-of-lists argument. It thinks it has only one dataset to be legended.


When I execute your second example I get this. Now ParametricPlot seems to have become confused. It has used the legend information to as a frame label!


Is there any chance any of our friends at WRI could point out my error???

Kind regards,

David
POSTED BY: David Keith
Posted 11 years ago
David,
I too wait for WRI to deal with this issue. The diverse number of tools in Mathematica allows you to play/experiment and achieve your aim. I think there has been a significant progressive improvement in legend capabilities and the range of options/approaches provides fertile ground for 'work arounds' while issue gets sorted.
POSTED BY: Mark Dooris
Posted 11 years ago
In 9.0.1.0 Windows

Half of the legends, with color coding
ParametricPlot[{{2r Cos[t],r Sin[t]},{r Cos[t],2r Sin[t]}},{t,0,2 Pi},{r,0,1},
   Mesh->False, PlotLegends->{x,y}]

Both of the legends, without color coding
ParametricPlot[{{2r Cos[t],r Sin[t]},{r Cos[t],2r Sin[t]}},{t,0,2 Pi},{r,0,1},
   Mesh->False, PlotLegends->{{x},{y}}]
POSTED BY: Bill Simpson
Posted 11 years ago
I'm on the current release of 9, and ParametricPlot documentation does list PlotLegends as an option. And syntax coloring recognizes it. But executing the example code, which shows the legend in the output, produces in fact no legend. It looks broken.
POSTED BY: David Keith
Is it possible that the user is using a prior version of Mathematica? I have Mma7 and do not have the PlotLegends listed as an option in the  documentation (in the product) and cannot use it while i do see "PlotLegends" as an option for Mma9 (on the web). Disregard this post if this possibility was already considered. 
POSTED BY: Isaac Abraham
Posted 11 years ago
I think the code was damaged in your post. Here it is in a box. And I agree, the documentation shows this code producing legends. But even if executed in place, the legendsare not produced as they are shown in the documentation.
ParametricPlot[{{2 r Cos[t], r Sin[t]}, {r Cos[t], 2 r Sin[t]}}, {t,
  0, 2 Pi}, {r, 0, 1}, Mesh -> False, PlotLegends -> Automatic]
POSTED BY: David Keith
Reply to this discussion
Community posts can be styled and formatted using the Markdown syntax.
Reply Preview
Attachments
Remove
or Discard

Group Abstract Group Abstract