Legends remain challenging (in my experience). While waiting for resolution of this issue (or perhaps greater insights), I post this to illustrate/motivate and I am certain people can create more 'interesting' legends, however, that you can customize (in this case
SwatchLegend). In this case, the legend marker is created from a user defined 'representative' region and
MeshFunctions just used to make 'interesting marker'.
fun[f_, {s_, s0_, s1_}, {t_, t0_, t1_}, lab_, mf_, mn_, col_, reg_,
sz_,sc_] := Module[{pl, sw},
pl = MapThread[
ParametricPlot[f, {s, s0, s1}, {t, t0, t1}, MeshFunctions -> mf,
Mesh -> Round[sc mn/sz], PlotStyle -> #2,
RegionFunction -> #1] &, {reg, col}];
sw = SwatchLegend[col, lab, LegendMarkers -> pl,
LegendMarkerSize -> sz ];
ParametricPlot[f, {s, s0, s1}, {t, t0, t1}, MeshFunctions -> mf,
Mesh -> mn, PlotStyle -> col, PlotLegends -> sw]]
Example:
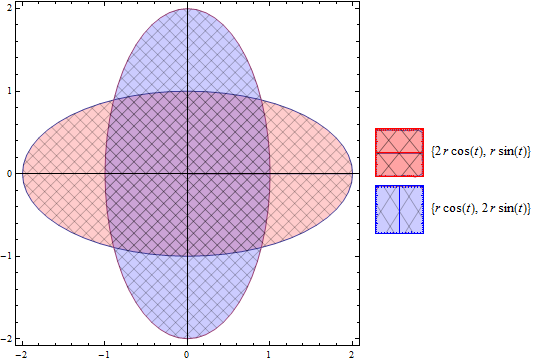
expr = {{2 r Cos[t], r Sin[t]}, {r Cos[t], 2 r Sin[t]}};
fun[expr, {r, 0, 1}, {t, 0, 2 Pi},
TraditionalForm[#] & /@ expr, {#1 + #2 &, #1 - #2 &},
30, {Red,
Blue}, {Function[{x, y, u, v}, 0.5 < x < 1 && -0.2 < y < 0.2],
Function[{x, y, u, v}, -0.4 < x < 0.4 && 1 < y < 1.5]}, 50,5]
Or
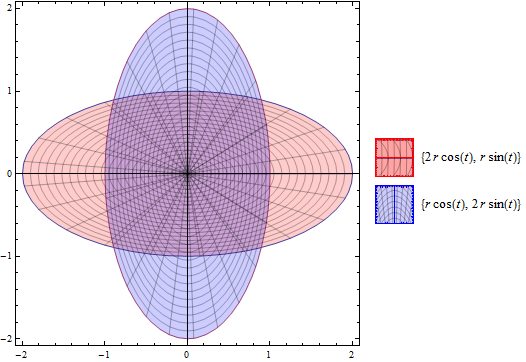
fun[expr, {r, 0, 1}, {t, 0, 2 Pi},
TraditionalForm[#] & /@ expr, {#3 &, #4 &}, 20, {Red,
Blue}, {Function[{x, y, u, v}, 0.5 < x < 1 && -0.2 < y < 0.2],
Function[{x, y, u, v}, -0.4 < x < 0.4 && 1 < y < 1.5]}, 40, 15]
This is not elegant but I post to show work around and capabilities of other approaches.
A related post
here (using similar approach for
RegionPlot)


