Hello Jim,
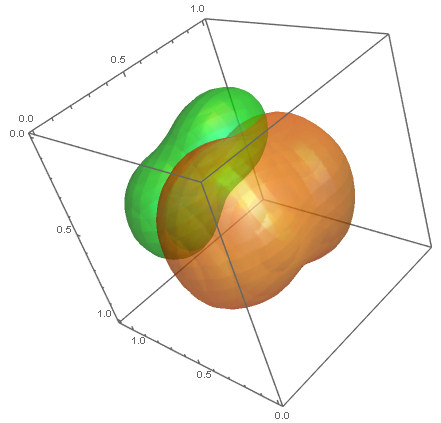
great, thanks for this! This is what I was looking for. It works for the 3D case too (looks much cooler in 3D).
dist1 = MixtureDistribution[{1,
    1}, {MultinormalDistribution[{0.3, 0.5,
      0.4}, {{0.01, 0, 0}, {0, 0.02, 0}, {0, 0, 0.01}}],
    MultinormalDistribution[{0.7, 0.6,
      0.5}, {{0.01, 0, 0}, {0, 0.02, 0}, {0, 0, 0.02}}]}];
data1 = RandomVariate[dist1, 2000];
dist2 = MixtureDistribution[{1,
    1}, {MultinormalDistribution[{0.6, 0.3,
      0.7}, {{0.01, 0, 0}, {0, 0.005, 0}, {0, 0, 0.005}}],
    MultinormalDistribution[{0.3, 0.5,
      0.8}, {{0.005, 0, 0}, {0, 0.01, 0}, {0, 0, 0.005}}]}];
data2 = RandomVariate[dist2, 2000];
ListPointPlot3D[{data1, data2}, PlotRange -> {{0, 1}, {0, 1}, {0, 1}},
  BoxRatios -> {1, 1, 1}]

dist1a = SmoothKernelDistribution[data1, {0.1, 0.1, 0.1}];
p1[x_, y_, z_] = PDF[dist1a, {x, y, z}];
dist2a = SmoothKernelDistribution[data2, {0.1, 0.1, 0.1}];
p2[x_, y_, z_] = PDF[dist2a, {x, y, z}];

proportion = 0.95;
density1 =
  Sort[PDF[dist1a, #] & /@
     data1][[Floor[(1 - proportion)*Length[data1]]]];
density2 =
  Sort[PDF[dist2a, #] & /@
     data2][[Floor[(1 - proportion)*Length[data2]]]];

ContourPlot3D[{p1[x, y, z] == density1, p2[x, y, z] == density2}, {x,
  0, 1}, {y, 0, 1}, {z, 0, 1.1}, Mesh -> None,
 ContourStyle -> {Directive[Orange, Opacity[0.5],
    Specularity[White, 30]],
   Directive[Green, Opacity[0.5], Specularity[White, 30]]}]

Cheers,
Max