First, the initial condition is also being applied at the boundary---hence the error message. To fix that, instead of T[x,y,0]== 5, you can write:
T[x,y,0]==If[x==0||x==L||y==0||y==l,0,5]
With that, your code using ''boundaries2'' works fine.
Now, to use ''boundaries'' , beyond fixing implementation of the initial condition, if you replace, in the argument of NDSolveValue,
{x, y} \[Element] \[CapitalOmega]
by
{x, 0, L}, {y,0, l}
then it works fine as well. I don't know why, though. I had never defined the domain of an equation using a region like you did, it's interesting..
So, it reads:
HeatEq = \!\(
\*SubscriptBox[\(\[PartialD]\), \(t\)]\(T[x, y, t]\)\) == Laplacian[
       T[x, y, t], {x, y}];
L = 2; l = 1/2; tmax = 15;
\[CapitalOmega] = Rectangle[{0, 0}, {L, l}];
boundaries = {T[x, y, 0] ==
    If[x == 0 || x == 2 || y == 0 || y == 1/2, 0, 5],
   T[0, y, t] == 0, T[L, y, t] == 0,
      T[x, 0, t] == 0, T[x, l, t] == 0};
boundaries2 = {DirichletCondition[T[x, y, t] == 0, True],
      T[x, y, 0] == If[x == 0 || x == 2 || y == 0 || y == 1/2, 0, 5]};
sol = NDSolveValue[Join[{HeatEq}, boundaries],
      T, {x, 0, L}, {y, 0, l}, {t, 0, tmax}];
Animate[DensityPlot[
    sol[x, y, t], {x, y} \[Element] \[CapitalOmega]], {t, 0, tmax},
 AnimationRunning -> False]
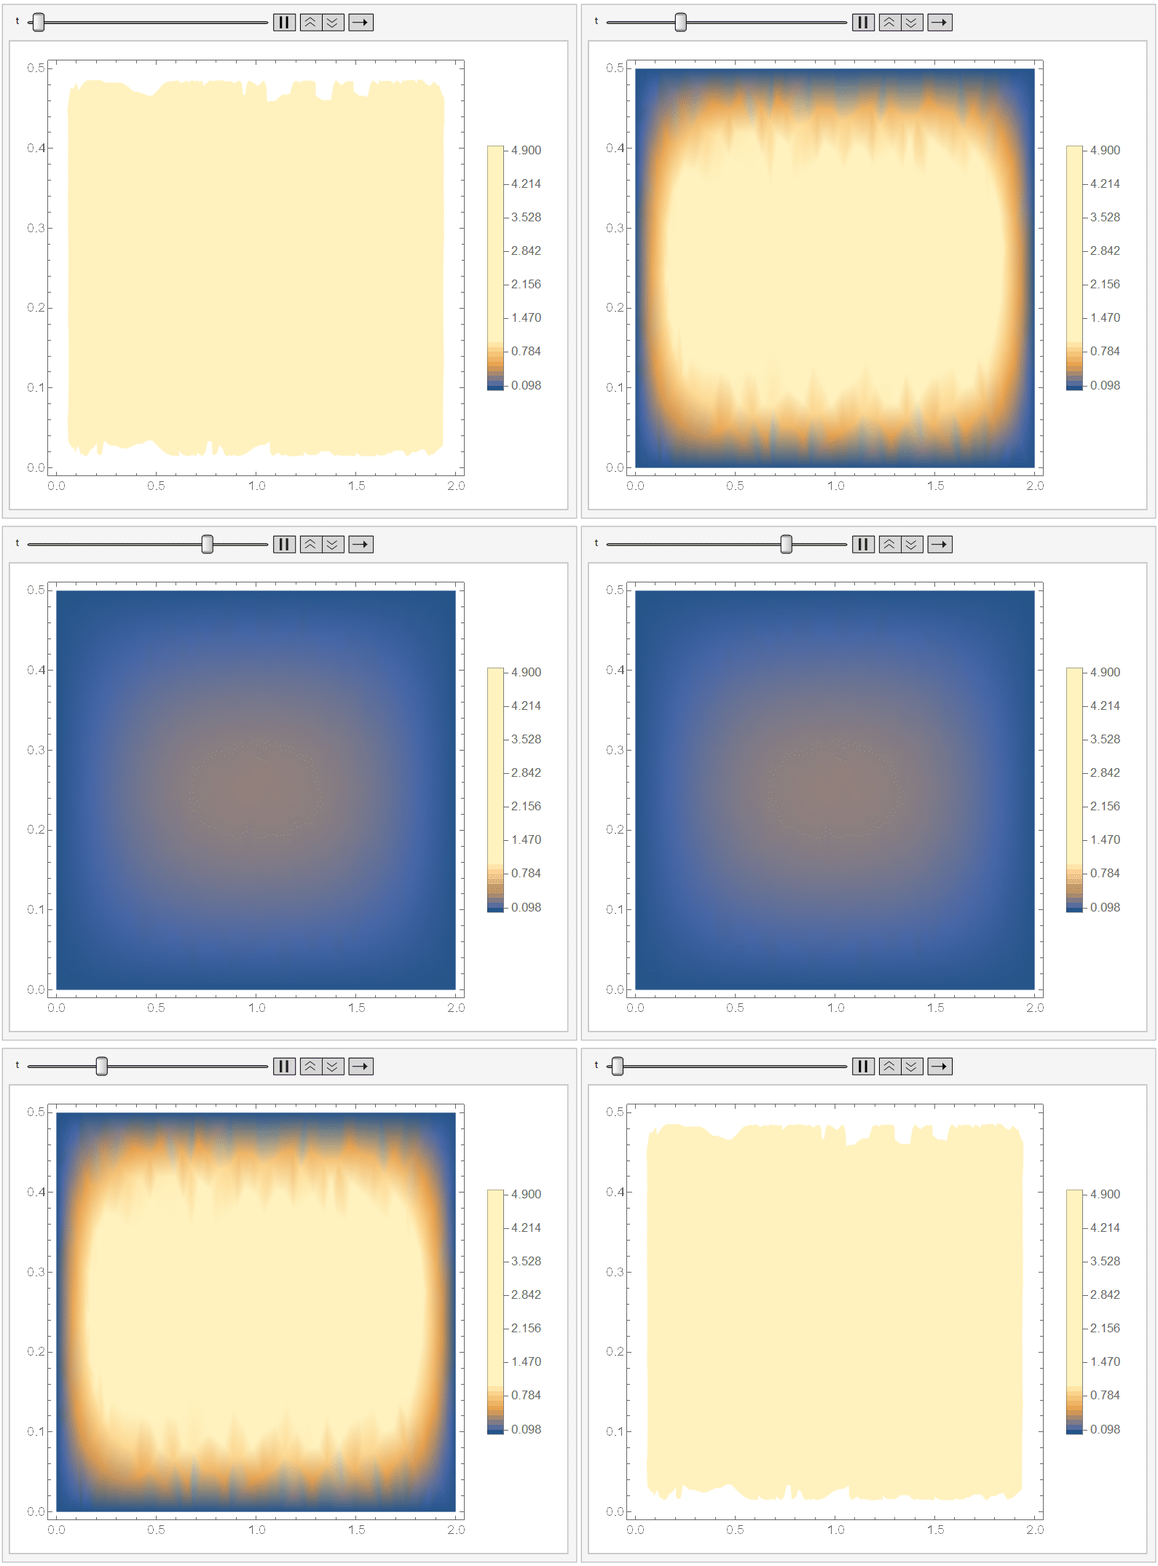
Regarding the visualization. To check that things make sense, you can use:
ListAnimate@Table[Plot3D[sol[x, y, t], {x, 0, L}, {y, 0, l}], {t, 0, 2/10, 1/100}]
And if you set ``ColorFunctionScaling -> False'' in the DensityPlot, then it won't apply a different scaling for each DensityPlot. Since it cools down fast, I chose the range {t, 0, 1/10}) and, adding a fixed legend:
Animate[DensityPlot[sol[x, y, t], {x, y} \[Element] \[CapitalOmega], PlotLegends -> BarLegend[{Automatic, {0, 5}}, 50], ColorFunctionScaling -> False], {t, 0, 1/10}]
It looks like:
