Message Boards Message Boards

0
|
2611 Views
|
2 Replies
|
1 Total Likes
View groups...
Share
Share this post:

ParametricPlot doesn't give what I expected

Posted 3 years ago

Hey guys, here's a very simple code I wrote, it's basically just one line. But I don't understand what is going on at all. I tried to parametrize two functions and to plot the result as a parametric plot. But the plot itself shows 2 lines? Does anyone see what is going on here? Upon changing the lower and upper bounds for u the behavior changes and I'm simply very confused.

Code:

ParametricPlot[{2*u^3/(u^2 - 1), 2*u^3/(1 + u^2)^2}, {u, 1.01, 5}, 
PlotRange -> All]

Thanks in advance!

J.D.

POSTED BY: Janis Köhler
2 Replies

Janis,

You need to also set the AspectRatio because the plot has a very small y values with huge x values.

ParametricPlot[{2 u^3/(u^2 - 1), 2 u^3/(1 + u^2)^2}, {u, 1.01, 5.}, 
 AspectRatio -> 0.5, PlotRange -> All]

The plot looks like two curves but it is actually the same curve if you look at the data. The manual way to see it is

ListLinePlot[
 Table[{2 u^3/(u^2 - 1), 2 u^3/(1 + u^2)^2}, {u, 1.01, 5, .01}], 
 PlotRange -> All]

Both give you
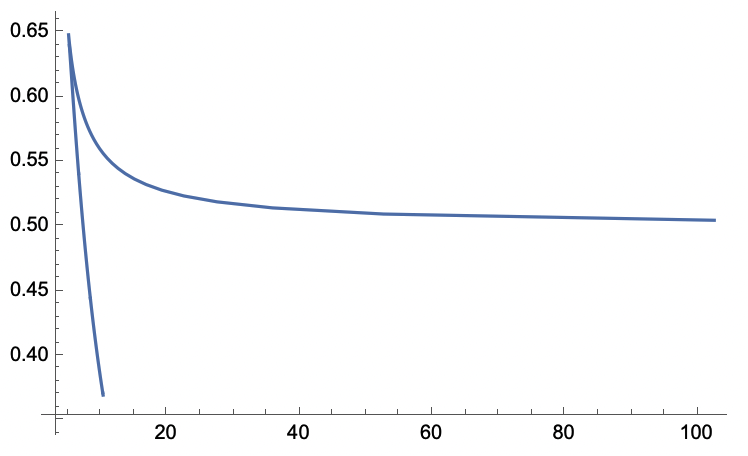
enter image description here

If you look at the terms, this makes sense:

Plot[{2 u^3/(u^2 - 1), 2 u^3/(1 + u^2)^2}, {u, 1.01, 5}]

The x curve goes to a minimum and then rises again so the parametric plot will have an inflection point.

Regards,

Neil

POSTED BY: Neil Singer
Posted 3 years ago

Thank you, that helps a lot.

J.D.

POSTED BY: Janis Köhler
Reply to this discussion
Community posts can be styled and formatted using the Markdown syntax.
Reply Preview
Attachments
Remove
or Discard

Group Abstract Group Abstract