Janis,
You need to also set the AspectRatio because the plot has a very small y values with huge x values.
ParametricPlot[{2 u^3/(u^2 - 1), 2 u^3/(1 + u^2)^2}, {u, 1.01, 5.},
 AspectRatio -> 0.5, PlotRange -> All]
The plot looks like two curves but it is actually the same curve if you look at the data. The manual way to see it is
ListLinePlot[
 Table[{2 u^3/(u^2 - 1), 2 u^3/(1 + u^2)^2}, {u, 1.01, 5, .01}],
 PlotRange -> All]
Both give you
If you look at the terms, this makes sense:
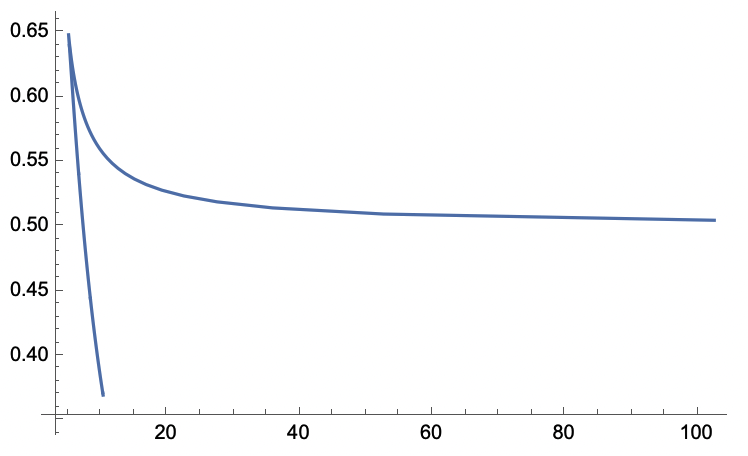
Plot[{2 u^3/(u^2 - 1), 2 u^3/(1 + u^2)^2}, {u, 1.01, 5}]
The x curve goes to a minimum and then rises again so the parametric plot will have an inflection point.
Regards,
Neil


