Message Boards Message Boards

0
|
3728 Views
|
2 Replies
|
1 Total Likes
View groups...
Share
Share this post:

RegionPlot in Shannon capacity theorem?

The Shannon Capacity Theorem identifies the limits of performance for bandwidth-limited and power-limited Gaussian channels.

In log-form, the theorem is defined by the following equation: enter image description here

In exponential form, the Capacity equation is: enter image description here

In locus-of-points form, the equation states that the Capacity Boundary is the locus of all points given by the following equation: enter image description here

The attached figure shows the Capacity Boundary. The region below the curve is referred to as the “feasible” region. The region above the curve is referred to as the “infeasible” region. As shown in the figure, the capacity is plotted on a Log-Linear graph.

enter image description here

I would like recommendations of how to perform a RegionPlot of the Log-Linear graph. I would like the see to RegionPlot the both below the curve and above the curve in two different color shades.

I have attached a copy of the program that I used to generate the graph.

POSTED BY: Edward Newsome
2 Replies

Hi Rohit:

Thanks. This is exactly what I had hope to accomplish. No, there was no particular reason to use RegionPlot, other than, I thought it was the appropriate method. And per you recommendation, I did investigate HatchFilling. For the future, I now have two more approaches in my toolbox. Again thanks.

POSTED BY: Edward Newsome
Posted 3 years ago

Hi Edward,

Is there a reason for wanting to use RegionPlot? How about this?

p1 = ListLogPlot[t6,
  GridLines -> {xgrid, ygrid},
  Joined -> True,
  Frame -> True,
  PlotLegends -> {"Shannon_Limit"},
  PlotStyle -> {Blue},
  FrameLabel -> {"\!\(\*FractionBox[\(Eb\), \(N0\)]\)dB",  "Spectrum Efficiency -- bit/sec/Hz"},
  GridLinesStyle -> {Directive[Thick, Black]},
  FrameTicks -> {{Automatic, Automatic}, {xticks, Automatic}},
  FrameStyle -> Directive[Bold],
  LabelStyle -> Directive[Black, Bold, 12],
  Filling -> {1 -> Top, 1 -> Bottom},
  FillingStyle -> {Directive[Opacity[0.25], Red], Directive[Opacity[0.25], Green]}]
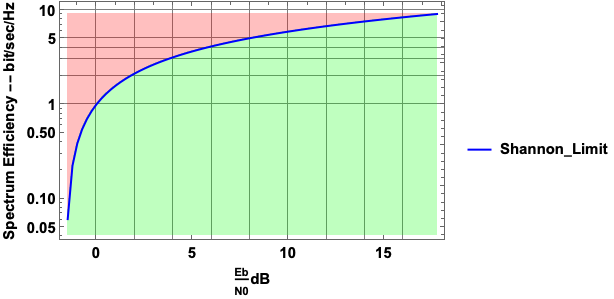
enter image description here

You may also want to check the documentation for HatchFilling.

POSTED BY: Rohit Namjoshi
Reply to this discussion
Community posts can be styled and formatted using the Markdown syntax.
Reply Preview
Attachments
Remove
or Discard

Group Abstract Group Abstract