Hi Edward,
Is there a reason for wanting to use RegionPlot? How about this?
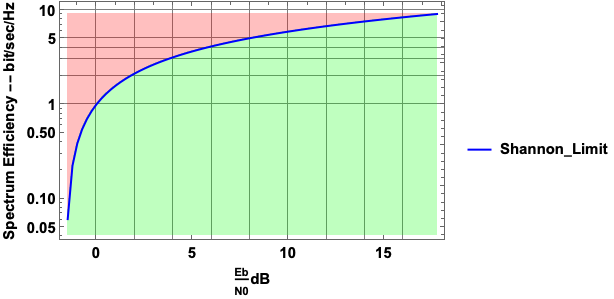
p1 = ListLogPlot[t6,
  GridLines -> {xgrid, ygrid},
  Joined -> True,
  Frame -> True,
  PlotLegends -> {"Shannon_Limit"},
  PlotStyle -> {Blue},
  FrameLabel -> {"\!\(\*FractionBox[\(Eb\), \(N0\)]\)dB",  "Spectrum Efficiency -- bit/sec/Hz"},
  GridLinesStyle -> {Directive[Thick, Black]},
  FrameTicks -> {{Automatic, Automatic}, {xticks, Automatic}},
  FrameStyle -> Directive[Bold],
  LabelStyle -> Directive[Black, Bold, 12],
  Filling -> {1 -> Top, 1 -> Bottom},
  FillingStyle -> {Directive[Opacity[0.25], Red], Directive[Opacity[0.25], Green]}]
You may also want to check the documentation for HatchFilling.


