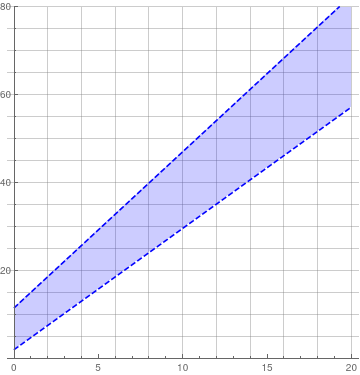
I want to plot the region between the two functions ...
One more approach:
Plot[{11.61 + 3.555 x, 2.094 + 2.761 x}, {x, 0, 20},
 PlotRange -> {0, 80}, AspectRatio -> 1,
 PlotStyle -> Directive[Dashed, Blue], Filling -> {1 -> {2}},
 FillingStyle -> Directive[Blue],
 GridLines -> {Range[0, 100, 2], Range[0, 100, 5]}]
