Group Abstract Group Abstract

Message Boards Message Boards

0
|
3.4K Views
|
2 Replies
|
0 Total Likes
View groups...
Share
Share this post:

Plot a region plot between two functions

Posted 4 years ago

I want to plot the region between the two functions as in the image below:

desmos

I tried

RegionPlot[ 11.61 + 3.555 x < y && y < 2.094 + 2.761 x, {x, 0, 20}, {y, 0, 80}]

but I get a blank plot.

Any idea why?

In Desmos this was achieved using

11.61+3.555x<y<2.094+2.761x
POSTED BY: Ehud Behar
2 Replies

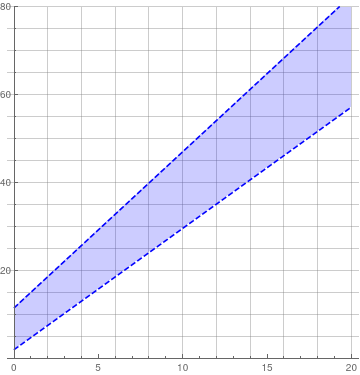
I want to plot the region between the two functions ...

One more approach:

Plot[{11.61 + 3.555 x, 2.094 + 2.761 x}, {x, 0, 20}, 
 PlotRange -> {0, 80}, AspectRatio -> 1, 
 PlotStyle -> Directive[Dashed, Blue], Filling -> {1 -> {2}}, 
 FillingStyle -> Directive[Blue], 
 GridLines -> {Range[0, 100, 2], Range[0, 100, 5]}]

enter image description here

POSTED BY: Henrik Schachner
Posted 4 years ago

Both predicates cannot be satisfied. Have to invert

RegionPlot[11.61 + 3.555 x > y && y > 2.094 + 2.761 x, {x, 0, 20}, {y, 0, 80},
 BoundaryStyle -> Dashed]

enter image description here

POSTED BY: Rohit Namjoshi
Reply to this discussion
Community posts can be styled and formatted using the Markdown syntax.
Reply Preview
Attachments
Remove
or Discard