MODERATORS' NOTE: full code and function definition are available at the end of the post.
For problems in 2 or 3 dimensions, step monitor can be used to plot the variable values of the internal steps taken by FindMinimum. A different approach, which is not limited to 3 dimensions, is to plot the value of the objective function vs the maximum constraint violation. A function FindMinimumWithPlot is defined in the attached notebook and some simple examples are shown here.
FindMinimumWithPlot[{x + y, x^2 + y^2 == 1}, {{x, 1}, {y, 2}}]
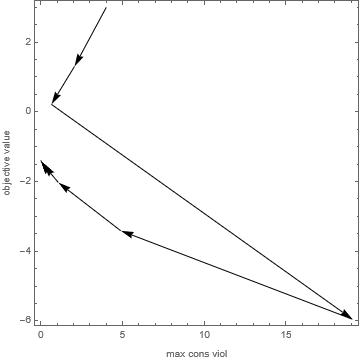
{-1.41421, {x -> -0.707107, y -> -0.707107},
 "max constraint violation" -> 2.3684*10^-9}

FindMinimumWithPlot[{x^2 - y^2,
  Cos[x - y] >= 0.5, -5 <= x <= 5, -5 <= y <= 5}, {{x, 4}, {y, -4}}]
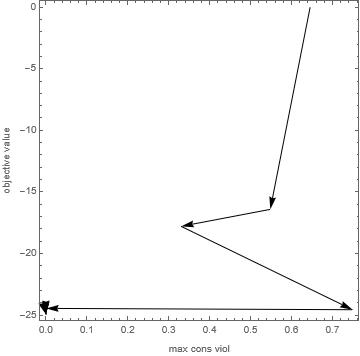
{-24.9443, {x -> 0.235988, y -> -5.},
 "max constraint violation" -> 4.13187*10^-8}

FindMinimumWithPlot[{x + y + z, (x - 1/2)^2 + y^2 + z^2 ==
   1, (x + 1/2)^2 + y^2 + z^2 == 1}, {{x, 1}, {y, -1}, {z, 1}},
 Method -> "IPOPT"]
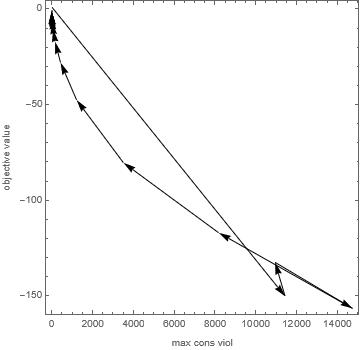
{-1.22474, {x -> 1.91952*10^-17, y -> -0.612372, z -> -0.612372},
 "max constraint violation" -> 1.42258*10^-12}


